four sets of data are shown in box - and - whisker plots. which set has the largest interquartile range? a a…
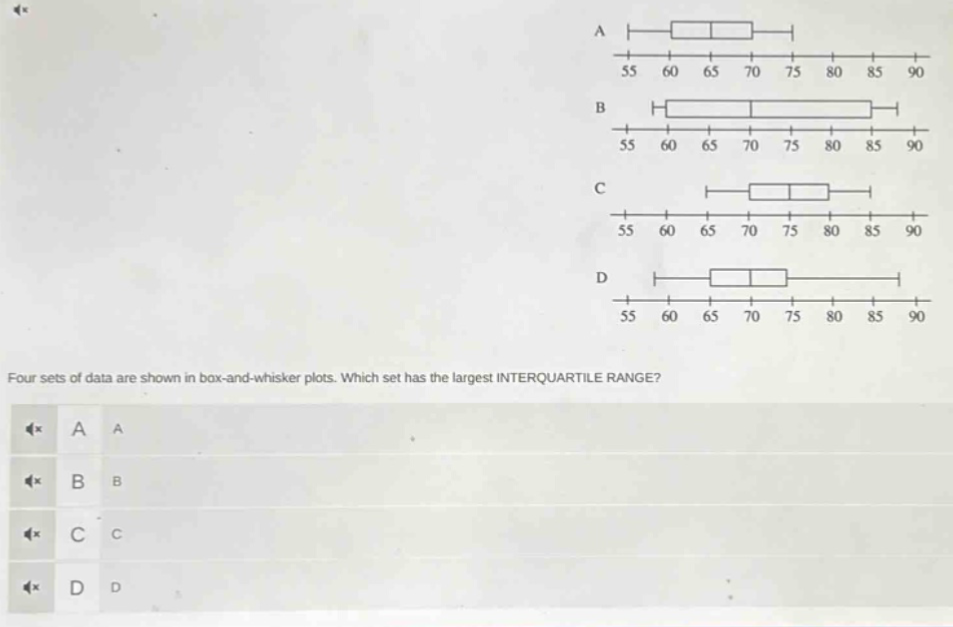
four sets of data are shown in box - and - whisker plots. which set has the largest interquartile range? a a b b c c d d
Answer
Explanation:
Step1: Recall IQR formula
The inter - quartile range (IQR) is $Q_3 - Q_1$, where $Q_3$ is the third - quartile and $Q_1$ is the first - quartile. In a box - and - whisker plot, the box represents the inter - quartile range, with the left side of the box being $Q_1$ and the right side being $Q_3$.
Step2: Measure box lengths
For plot A: The left side of the box is around 60 and the right side is around 65, so $IQR_A=65 - 60 = 5$. For plot B: The left side of the box is around 60 and the right side is around 80, so $IQR_B=80 - 60 = 20$. For plot C: The left side of the box is around 65 and the right side is around 75, so $IQR_C=75 - 65 = 10$. For plot D: The left side of the box is around 65 and the right side is around 75, so $IQR_D=75 - 65 = 10$.
Answer:
B.