frank often spills his fruit punch. below is the number of fruit punch stains in each of the six rooms in…
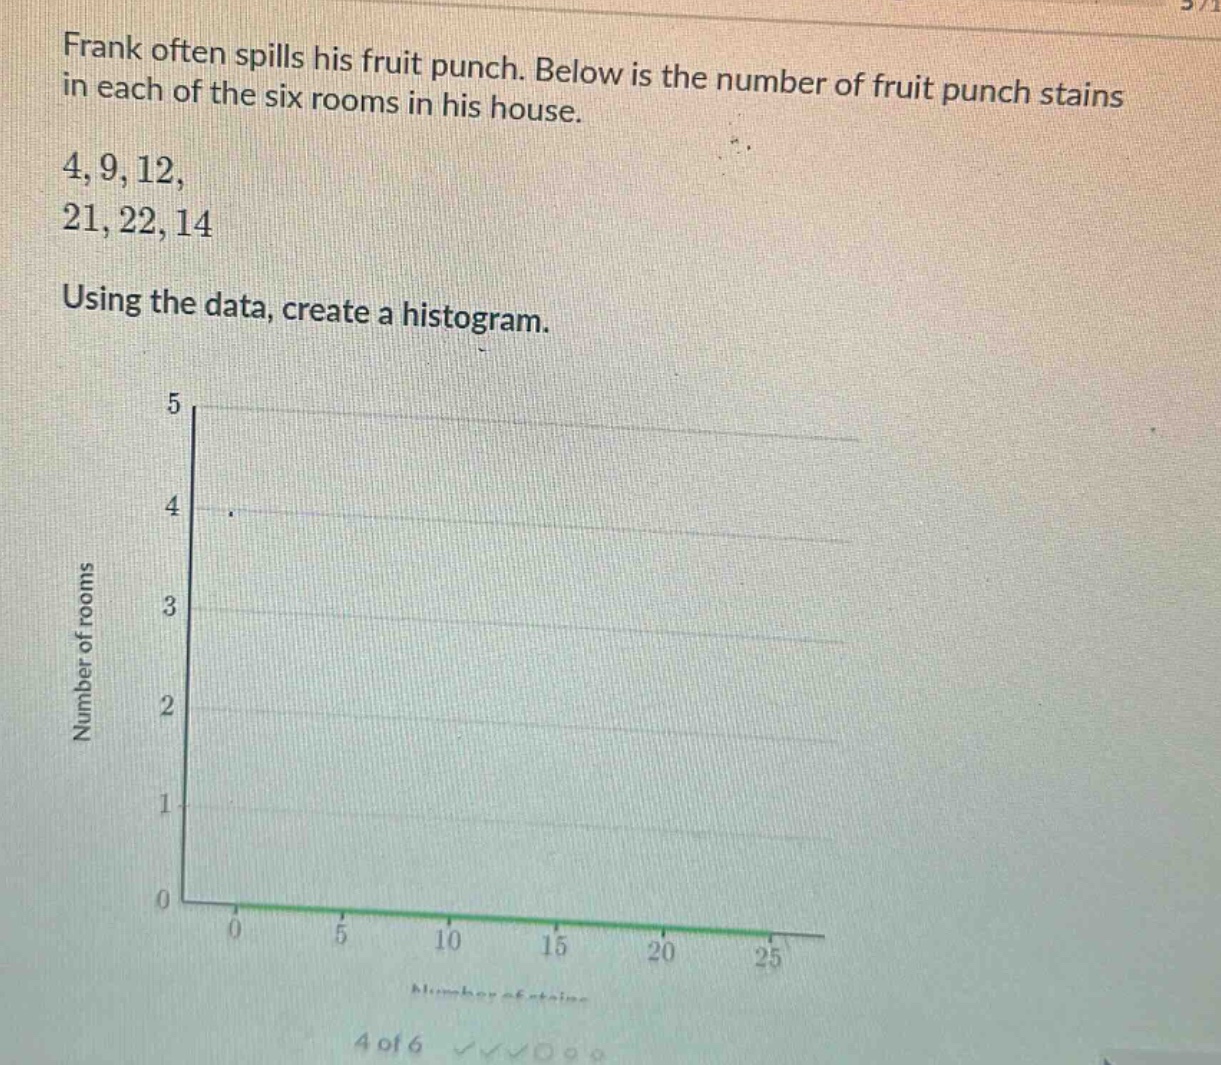
frank often spills his fruit punch. below is the number of fruit punch stains in each of the six rooms in his house. 4, 9, 12, 21, 22, 14 using the data, create a histogram.
Answer
Explanation:
Step1: Determine class - intervals
Let's use class - intervals: 0 - 4, 5 - 9, 10 - 14, 15 - 19, 20 - 24.
Step2: Count data in each interval
- For 0 - 4: 1 (the value 4)
- For 5 - 9: 1 (the value 9)
- For 10 - 14: 2 (the values 12 and 14)
- For 15 - 19: 0
- For 20 - 24: 2 (the values 21 and 22)
Step3: Draw the histogram
On the x - axis, label the class - intervals: 0 - 4, 5 - 9, 10 - 14, 15 - 19, 20 - 24. On the y - axis, label the frequency (number of rooms). Draw bars with heights corresponding to the frequencies in each class - interval.
Answer:
A histogram with class - intervals 0 - 4, 5 - 9, 10 - 14, 15 - 19, 20 - 24 on the x - axis and frequencies 1, 1, 2, 0, 2 respectively on the y - axis.