the frequency table represents the job status of a number of high school students. job status looking for…
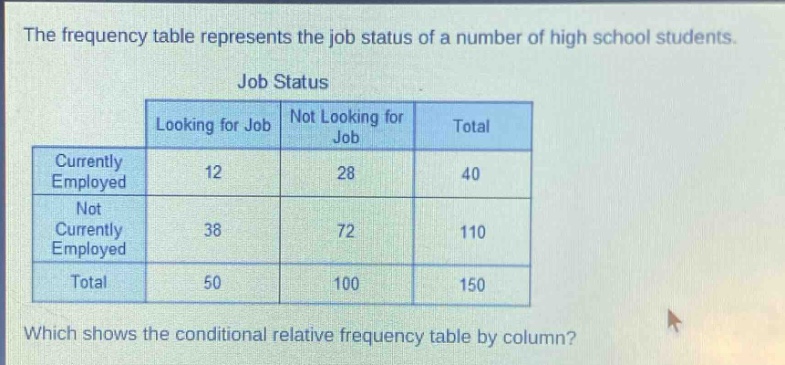
the frequency table represents the job status of a number of high school students. job status looking for job not looking for job total currently employed 12 28 40 not currently employed 38 72 110 total 50 100 150 which shows the conditional relative frequency table by column?
Answer
Answer:
To find the conditional - relative frequency table by column, we divide each value in a column by the total of that column. For the "Looking for Job" column:
- The conditional - relative frequency of "Currently Employed" given "Looking for Job" is $\frac{12}{50}=0.24$.
- The conditional - relative frequency of "Not Currently Employed" given "Looking for Job" is $\frac{38}{50}=0.76$. For the "Not Looking for Job" column:
- The conditional - relative frequency of "Currently Employed" given "Not Looking for Job" is $\frac{28}{100}=0.28$.
- The conditional - relative frequency of "Not Currently Employed" given "Not Looking for Job" is $\frac{72}{100}=0.72$.
The conditional - relative frequency table by column is:
| Job Status | Looking for Job | Not Looking for Job |
|---|---|---|
| Currently Employed | 0.24 | 0.28 |
| Not Currently Employed | 0.76 | 0.72 |
Explanation:
Step1: Calculate first conditional - relative frequency
Divide 12 by 50. $\frac{12}{50}=0.24$
Step2: Calculate second conditional - relative frequency
Divide 38 by 50. $\frac{38}{50}=0.76$
Step3: Calculate third conditional - relative frequency
Divide 28 by 100. $\frac{28}{100}=0.28$
Step4: Calculate fourth conditional - relative frequency
Divide 72 by 100. $\frac{72}{100}=0.72$