the frequency table shows a set of data collected by a doctor for adult patients who were diagnosed with a…
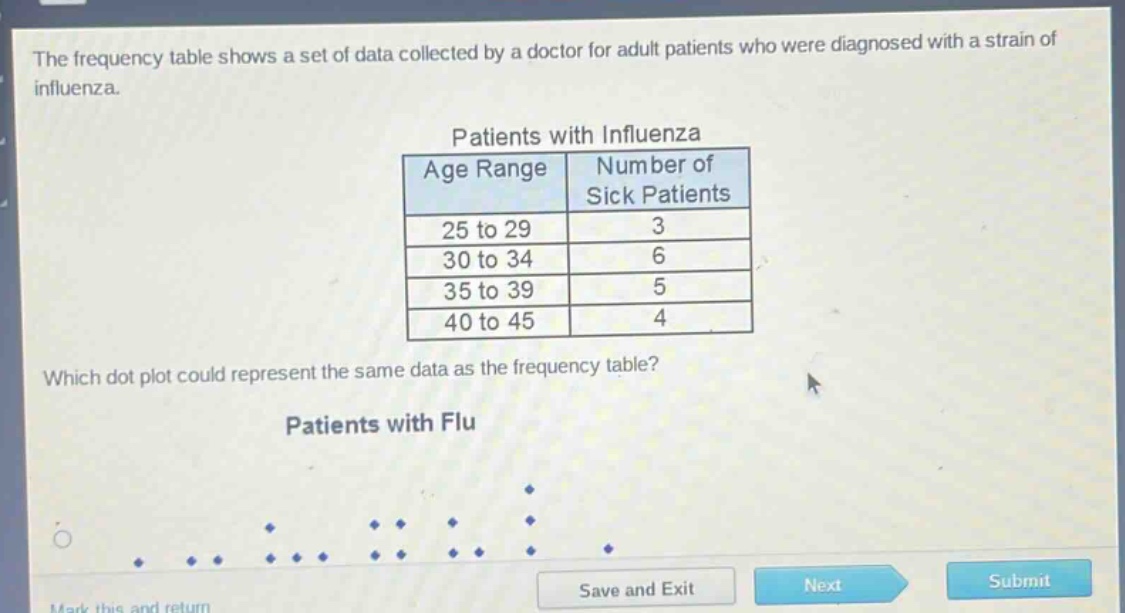
the frequency table shows a set of data collected by a doctor for adult patients who were diagnosed with a strain of influenza.\n\npatients with influenza\n| age range | number of sick patients |\n| ---- | ---- |\n| 25 to 29 | 3 |\n| 30 to 34 | 6 |\n| 35 to 39 | 5 |\n| 40 to 45 | 4 |\n\nwhich dot - plot could represent the same data as the frequency table?\n\npatients with flu
Answer
Explanation:
Step1: Analyze age - range and frequency
The age - range 25 - 29 has 3 sick patients, 30 - 34 has 6 sick patients, 35 - 39 has 5 sick patients and 40 - 45 has 4 sick patients.
Step2: Check dot - plot representation
In a dot - plot, for the age - range 25 - 29, there should be 3 dots, for 30 - 34 there should be 6 dots, for 35 - 39 there should be 5 dots and for 40 - 45 there should be 4 dots.
Answer:
The dot - plot that has 3 dots for the age - range 25 - 29, 6 dots for the age - range 30 - 34, 5 dots for the age - range 35 - 39 and 4 dots for the age - range 40 - 45. (Since no options are given in text form, the general answer based on the data analysis is provided. If there were options like A, B, C etc. with dot - plots, the correct option identifier along with the description of the dot - plot in that option would be given).