the function in the table below shows the relationship between the total number of houses built in an area…
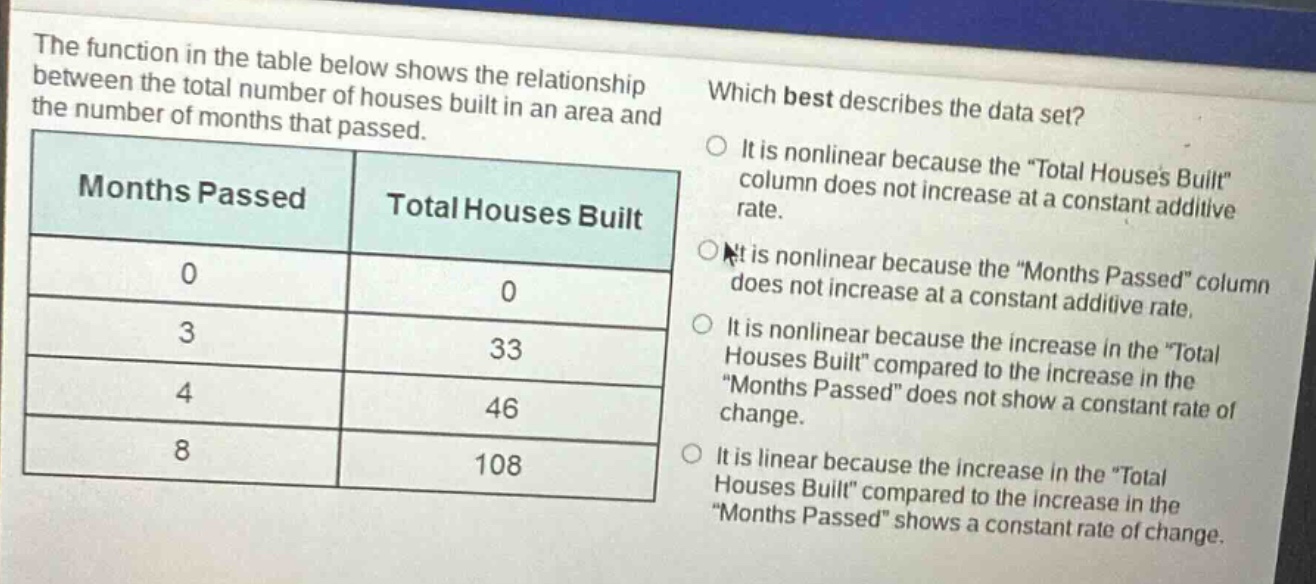
the function in the table below shows the relationship between the total number of houses built in an area and the number of months that passed.\n|months passed|total houses built|\n|----|----|\n|0|0|\n|3|33|\n|4|46|\n|8|108|\nwhich best describes the data set?\nit is nonlinear because the \total houses built\ column does not increase at a constant additive rate.\nit is nonlinear because the \months passed\ column does not increase at a constant additive rate.\nit is nonlinear because the increase in the \total houses built\ compared to the increase in the \months passed\ does not show a constant rate of change.\nit is linear because the increase in the \total houses built\ compared to the increase in the \months passed\ shows a constant rate of change.
Answer
Answer:
It is nonlinear because the increase in the "Total Houses Built" compared to the increase in the "Months Passed" does not show a constant rate of change.
Explanation:
Step1: Calculate rate - of - change between first two points
For points (0,0) and (3,33), rate of change $=\frac{33 - 0}{3 - 0}=11$
Step2: Calculate rate - of - change between second and third points
For points (3,33) and (4,46), rate of change $=\frac{46 - 33}{4 - 3}=13$
Step3: Calculate rate - of - change between third and fourth points
For points (4,46) and (8,108), rate of change $=\frac{108 - 46}{8 - 4}=\frac{62}{4}=15.5$ Since the rates of change ($11$, $13$, $15.5$) are not constant, the data set is nonlinear.