gabby is working on reducing traffic in her town. last week, she tracked how many cars drove down main…
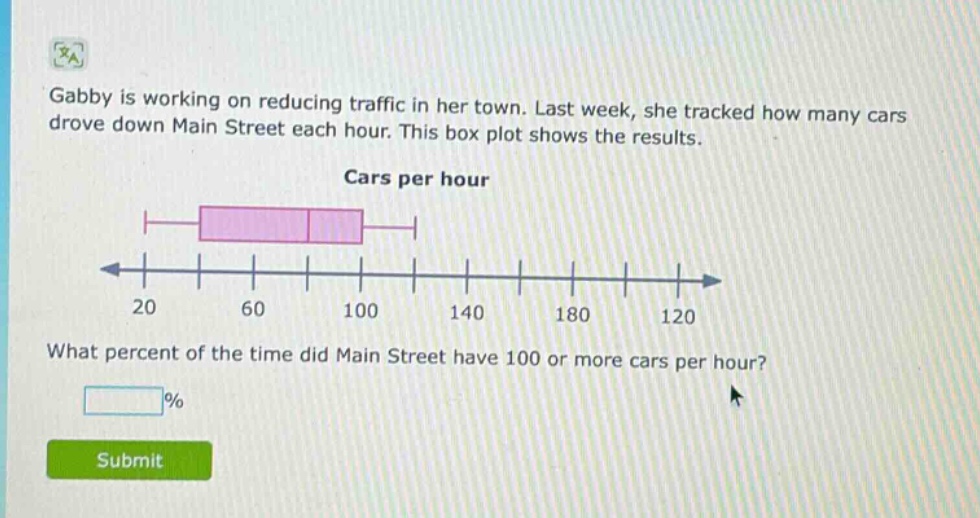
gabby is working on reducing traffic in her town. last week, she tracked how many cars drove down main street each hour. this box plot shows the results. cars per hour what percent of the time did main street have 100 or more cars per hour? %
Answer
Explanation:
Step1: Understand box - plot quartiles
In a box - plot, the box represents the inter - quartile range (IQR). The left side of the box is the first quartile ($Q_1$), the line inside the box is the median ($Q_2$), and the right side of the box is the third quartile ($Q_3$). The whiskers extend to the minimum and maximum values within 1.5 * IQR of the quartiles. Here, the value 100 is the third - quartile ($Q_3$).
Step2: Recall quartile percentages
The first quartile ($Q_1$) represents the 25th percentile, the median ($Q_2$) represents the 50th percentile, and the third quartile ($Q_3$) represents the 75th percentile.
Step3: Calculate the percentage of values 100 or more
Since 100 is the third - quartile ($Q_3$), 25% of the data lies above the third quartile. So the percentage of the time Main Street had 100 or more cars per hour is 25%.
Answer:
25