gabby is working on reducing traffic in her town. last week, she tracked how many cars drove down main…
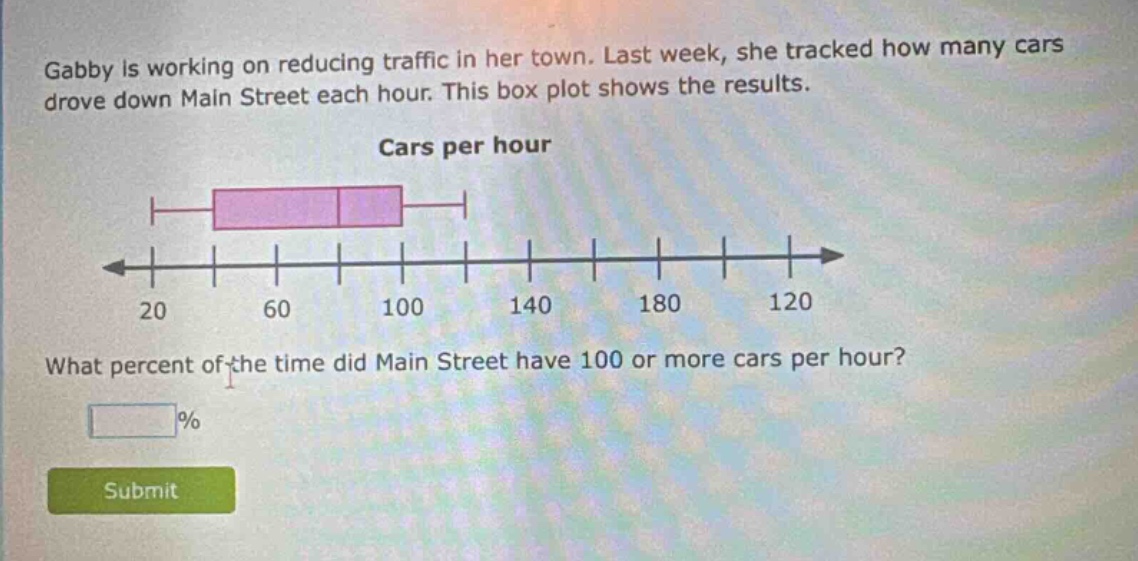
gabby is working on reducing traffic in her town. last week, she tracked how many cars drove down main street each hour. this box plot shows the results. cars per hour what percent of the time did main street have 100 or more cars per hour? % submit
Answer
Answer:
50
Explanation:
Step1: Comprender la estructura del diagrama de caja
Un diagrama de caja divide los datos en cuatro cuartiles. El valor 100 es la mediana (segundo cuartil, Q2).
Step2: Calcular el porcentaje
Los valores mayores o iguales a la mediana representan el 50% de los datos. Entonces, el 50% del tiempo Main Street tuvo 100 o más autos por hora.