gemma is creating a histogram based on the table below.\n| salary range | number of people |\n| ---- |…
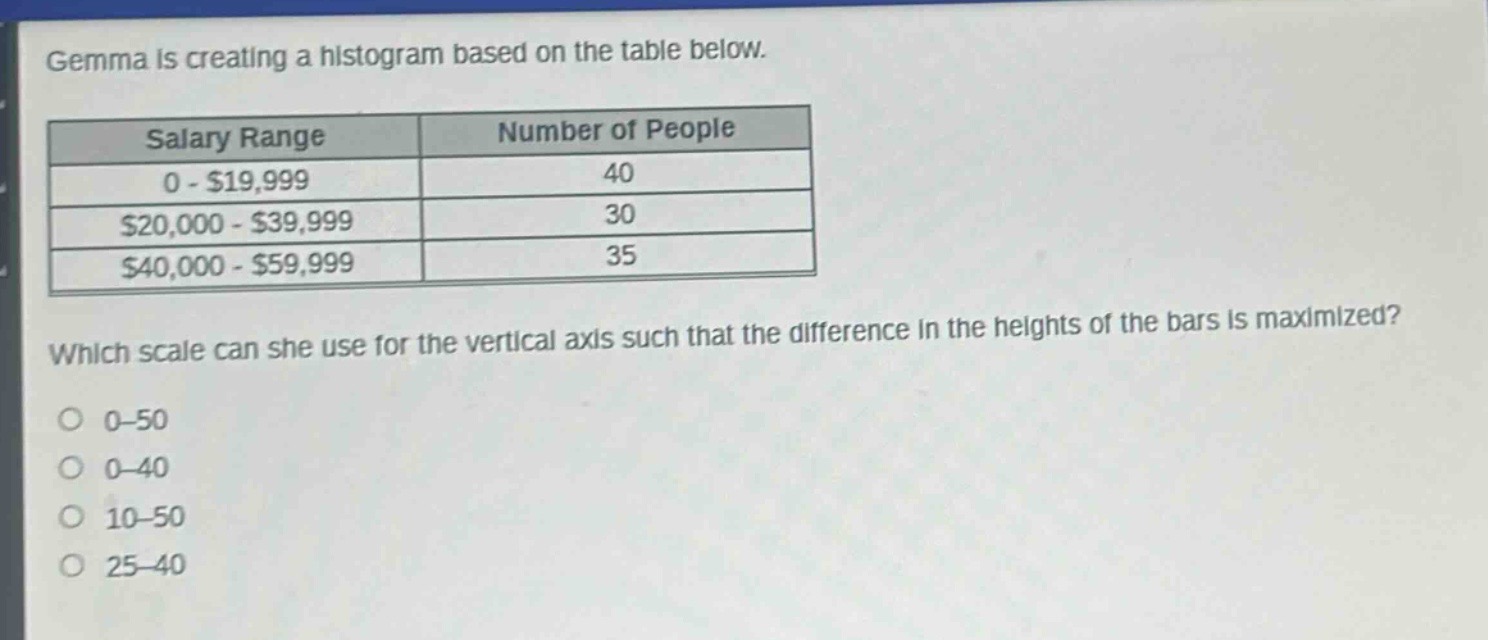
gemma is creating a histogram based on the table below.\n| salary range | number of people |\n| ---- | ---- |\n| 0 - $19,999 | 40 |\n| $20,000 - $39,999 | 30 |\n| $40,000 - $59,999 | 35 |\nwhich scale can she use for the vertical axis such that the difference in the heights of the bars is maximized?\no 0 - 50\no 0 - 40\no 10 - 50\no 25 - 40
Answer
Answer:
10 - 50
Explanation:
Step1: Analyze the data range
The number of people values are 40, 30, 35.
Step2: Evaluate each option
For 0 - 50, the differences are visible but not maximized compared to others. For 0 - 40, 40 is the maximum value and the differences will be less pronounced. For 25 - 40, some data points are close to the boundaries and differences won't be large. For 10 - 50, the lower - bound is set away from 0, which maximizes the visual differences between the bar heights for the values 40, 30, 35.