what is the general shape of the data?\nskewed\nsymmetric\nconstant\nmany peaks and valleys\ndone\nweight of…
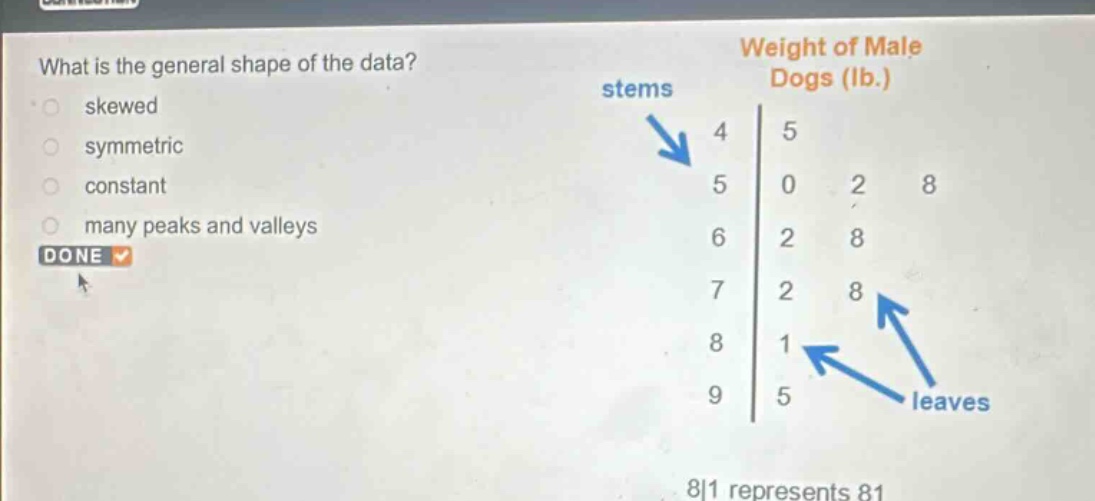
what is the general shape of the data?\nskewed\nsymmetric\nconstant\nmany peaks and valleys\ndone\nweight of male dogs (lb.)\nstems\n4 5\n5 0 2 8\n6 2 8\n7 2 8\n8 1\n9 5\nleaves\n8|1 represents 81
Answer
Explanation:
Step1: Analyze the stem - and - leaf plot
The data values are 45, 50, 52, 58, 62, 68, 72, 78, 81, 95.
Step2: Check for symmetry
The data is not evenly distributed around a central value.
Step3: Check for skewness
The tail of the data extends towards the larger values (95 is a relatively large out - lying value compared to others), so the data is skewed.
Step4: Check for constant
The values are not the same, so it's not constant.
Step5: Check for many peaks and valleys
There is no indication of multiple peaks and valleys in this small data set.
Answer:
skewed