give two observations comparing the two data sets based on the box plots.
give two observations comparing the two data sets based on the box plots.
Answer
Brief Explanations:
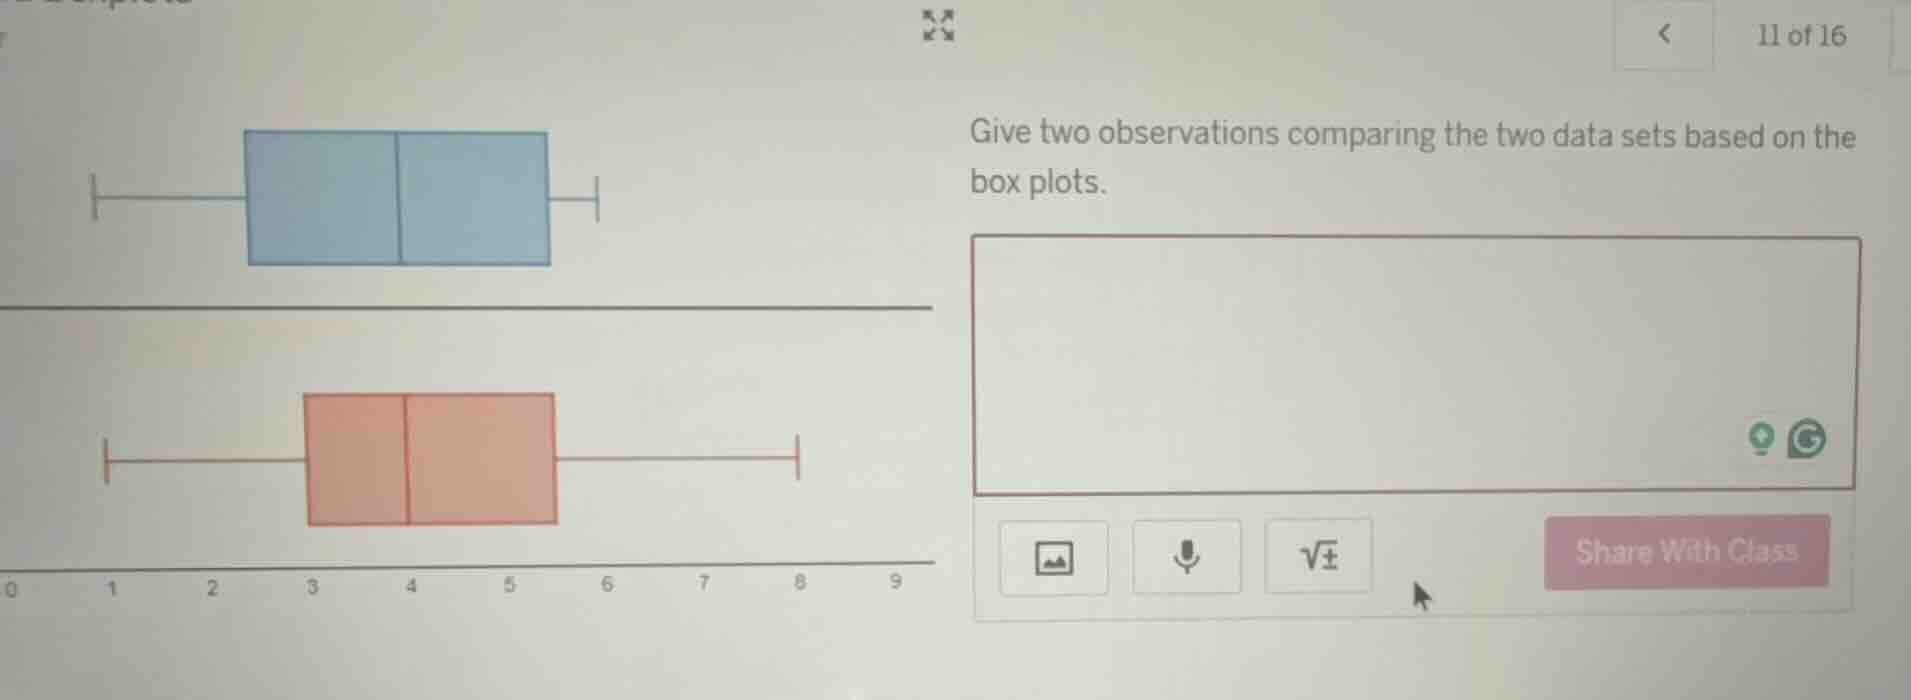
- First, compare the spread of the two datasets: the red box plot has a larger range (from ~0 to 8) than the blue one (from ~1 to 6), so the red dataset has greater overall variability.
- Next, compare the central tendency: the median (middle line of the box) for both datasets appears to be 4, so their median values are equal.
Answer:
- The dataset represented by the red box plot has a larger range (greater spread/variability) than the dataset represented by the blue box plot.
- The median value of the two datasets is the same (both have a median of 4).