government workers: the bureau of labor statistics reported that 14% of u.s. nonfarm workers are government…
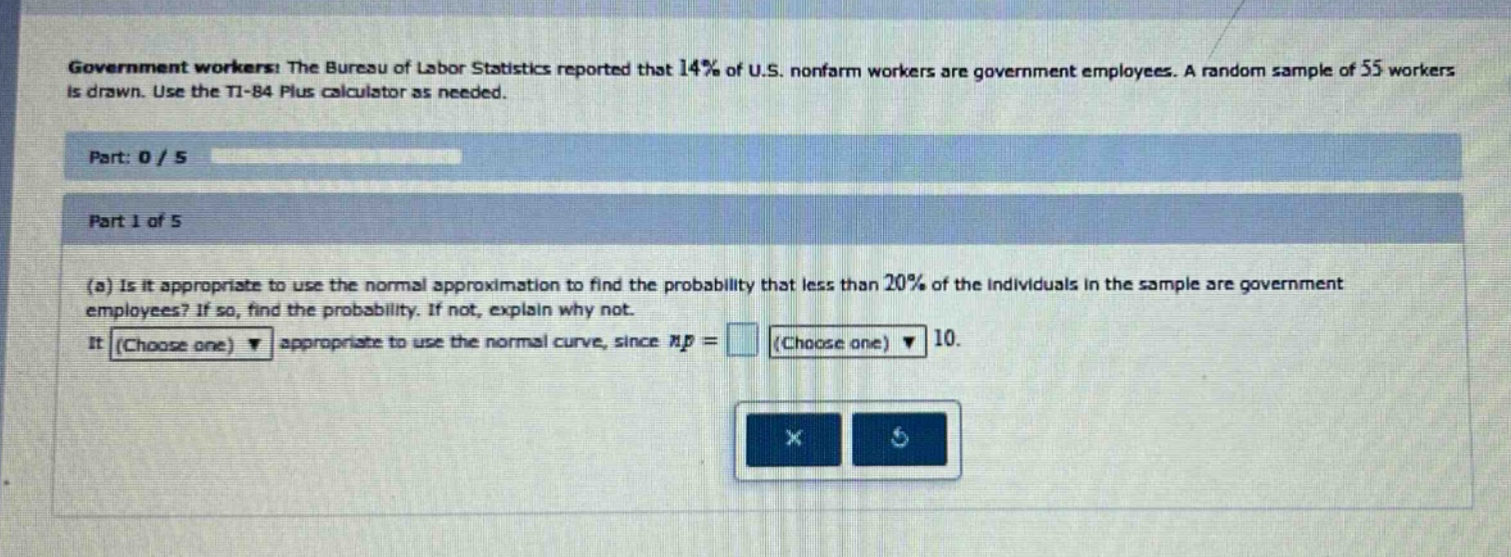
government workers: the bureau of labor statistics reported that 14% of u.s. nonfarm workers are government employees. a random sample of 55 workers is drawn. use the ti - 84 plus calculator as needed. part: 0 / 5 part 1 of 5 (a) is it appropriate to use the normal approximation to find the probability that less than 20% of the individuals in the sample are government employees? if so, find the probability. if not, explain why not. it (choose one) appropriate to use the normal curve, since np = (choose one) 10.
Answer
Explanation:
Step1: Identify values of n and p
Given $n = 55$ (sample - size) and $p=0.14$ (population proportion).
Step2: Calculate np
$np=55\times0.14 = 7.7$.
Step3: Check normal - approximation condition
The normal - approximation to the binomial is appropriate when $np\geq10$ and $n(1 - p)\geq10$. Since $np = 7.7<10$, it is not appropriate to use the normal curve.
Answer:
It is not appropriate to use the normal curve, since $np = 7.7<10$.