which graph best shows a positive correlation between the number of hours studied and the test scores?
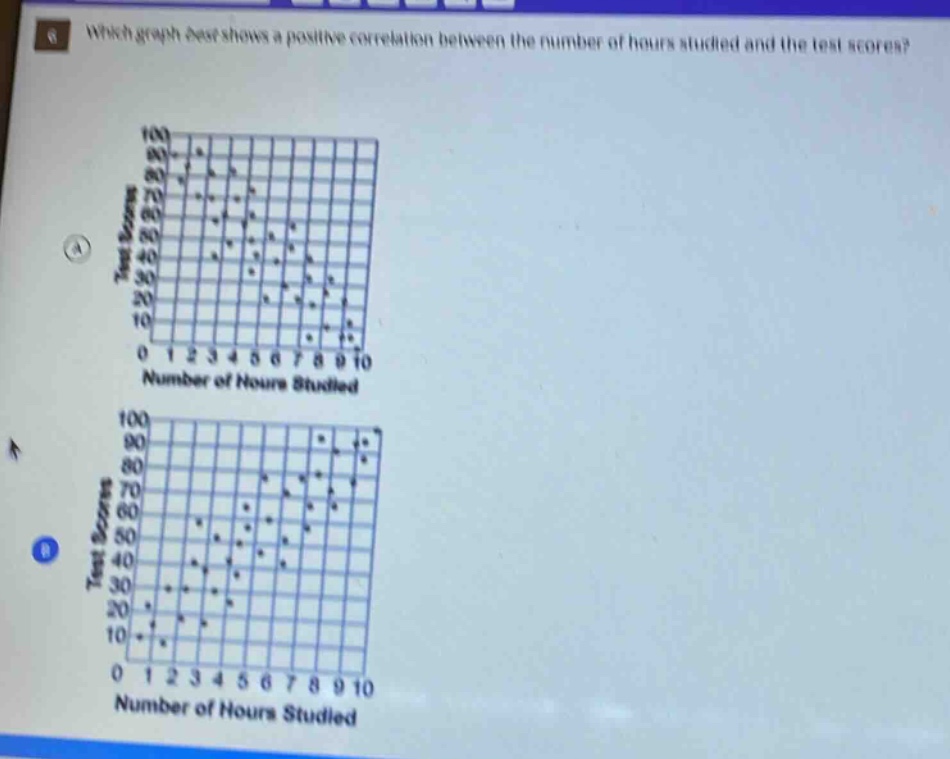
which graph best shows a positive correlation between the number of hours studied and the test scores?
Answer
Explanation:
Step1: Recall positive - correlation concept
In a positive - correlation, as the value of one variable (number of hours studied) increases, the value of the other variable (test scores) also tends to increase.
Step2: Analyze Graph A
In Graph A, as the number of hours studied increases, the test scores do not show a clear upward trend. There is no consistent increase in test scores with an increase in study hours.
Step3: Analyze Graph B
In Graph B, as the number of hours studied increases from 0 to 10, the test scores generally increase. There is a tendency for higher test scores as the number of study hours increases.
Answer:
B