the graph compares temperatures and numbers of cyclists. the equation of the trend line for the scatterplot…
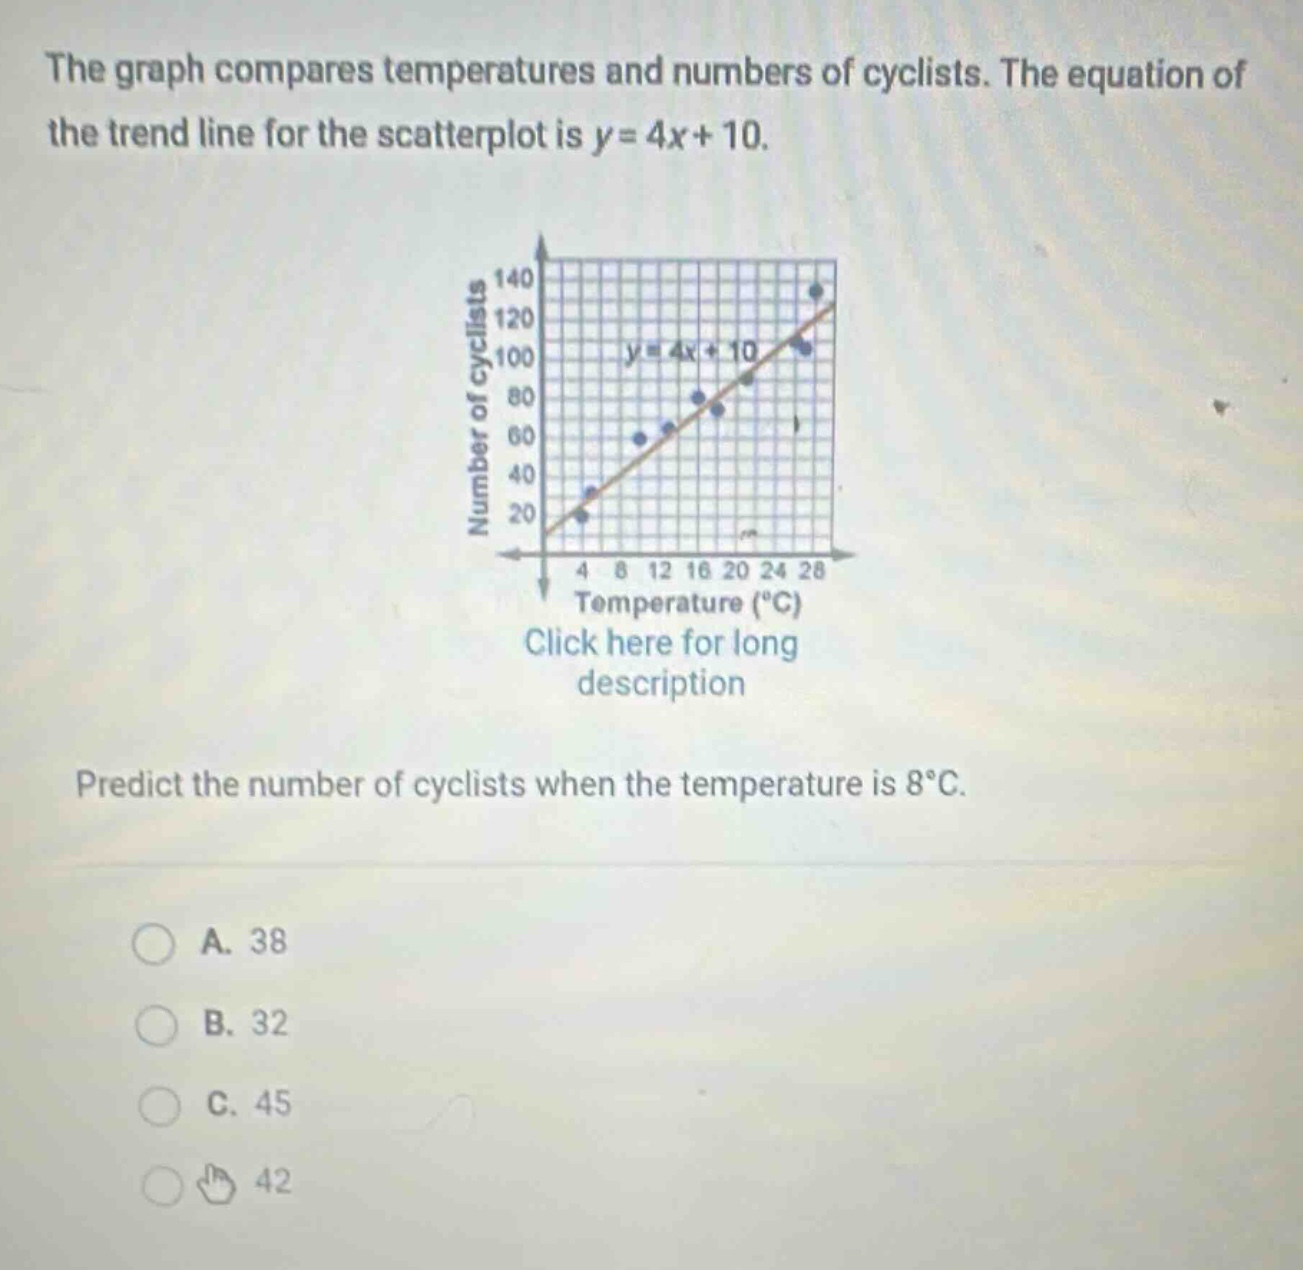
the graph compares temperatures and numbers of cyclists. the equation of the trend line for the scatterplot is y = 4x + 10. predict the number of cyclists when the temperature is 8°c. a. 38 b. 32 c. 45 d. 42
Answer
Explanation:
Step1: Identify the variables
The equation is $y = 4x+10$, where $x$ is temperature and $y$ is number of cyclists.
Step2: Substitute the value of $x$
Given $x = 8$. Substitute $x = 8$ into $y=4x + 10$. So $y=4\times8+10$.
Step3: Calculate the value of $y$
First, calculate $4\times8=32$. Then $y=32 + 10=42$.
Answer:
D. 42