the graph displays a residual plot that was constructed after running a least - squares regression on a set…
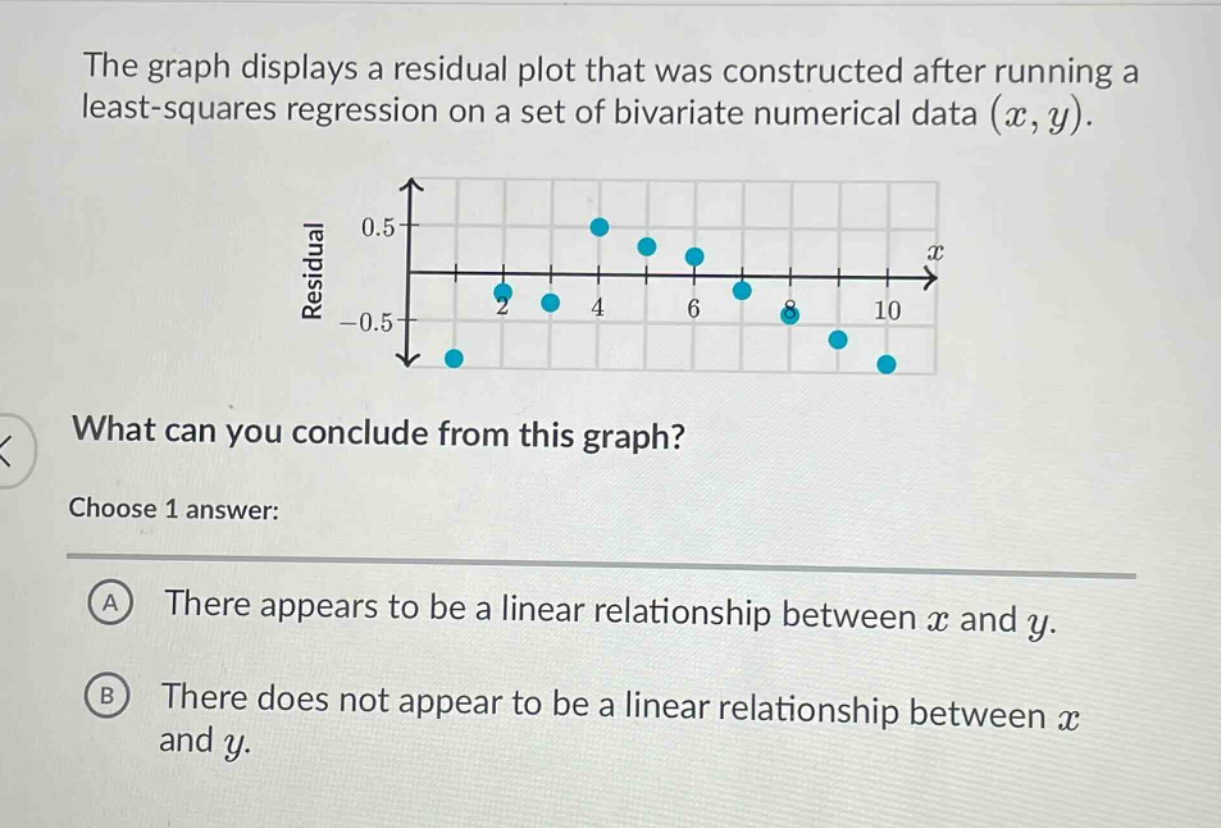
the graph displays a residual plot that was constructed after running a least - squares regression on a set of bivariate numerical data $(x,y)$. what can you conclude from this graph? choose 1 answer: a there appears to be a linear relationship between $x$ and $y$. b there does not appear to be a linear relationship between $x$ and $y$.
Answer
Brief Explanations:
A residual plot is used to assess the fit of a regression model. If the points in a residual plot show no pattern (random scatter), it indicates a good fit for a linear model. However, if there is a pattern (such as a curve), it suggests that a linear model is not appropriate. In this plot, there is no random scatter; instead, the points seem to follow a non - random pattern (they do not form a random cloud around the zero - residual line).
Answer:
B. There does not appear to be a linear relationship between (x) and (y).