the graph below is an ogive of scores on a math test. the vertical axis in an ogive is the cumulative…
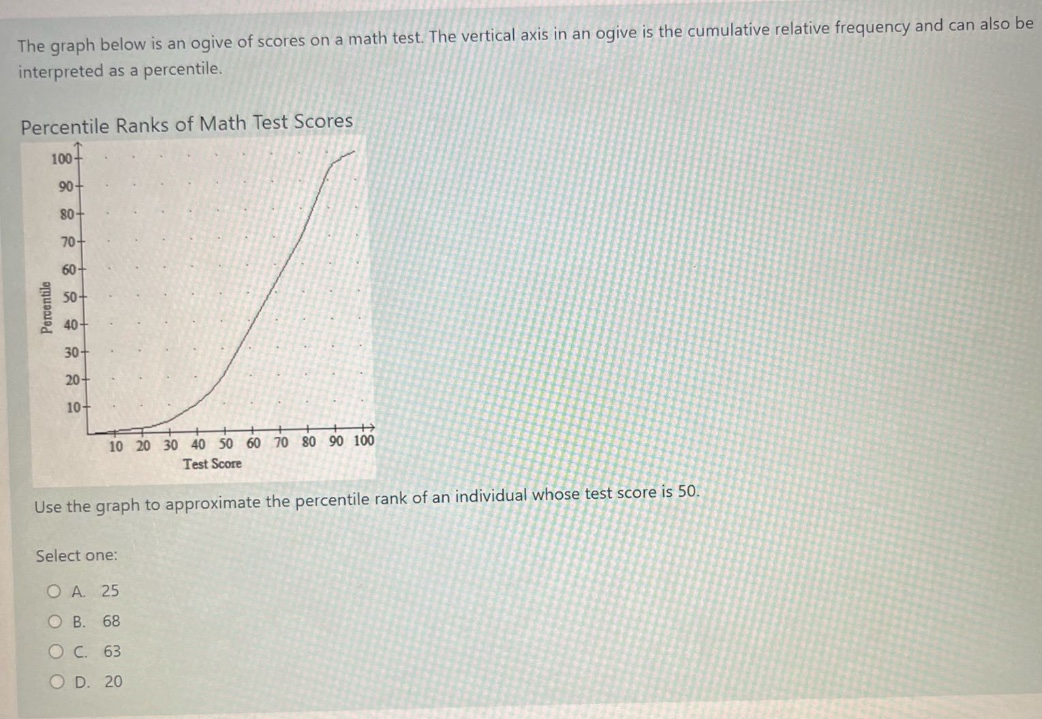
the graph below is an ogive of scores on a math test. the vertical axis in an ogive is the cumulative relative frequency and can also be interpreted as a percentile.\npercentile ranks of math test scores\nuse the graph to approximate the percentile rank of an individual whose test score is 50.\nselect one:\na. 25\nb. 68\nc. 63\nd. 20
Answer
Explanation:
Step1: Locate test - score on x - axis
Locate 50 on the horizontal test - score axis.
Step2: Find corresponding percentile
Draw a vertical line up from 50 on the x - axis until it intersects the ogive curve. Then draw a horizontal line from the intersection point to the vertical percentile axis. The approximate value on the percentile axis is around 20.
Answer:
D. 20