the graph below represents data that was collected by students on the number of social media posts they made…
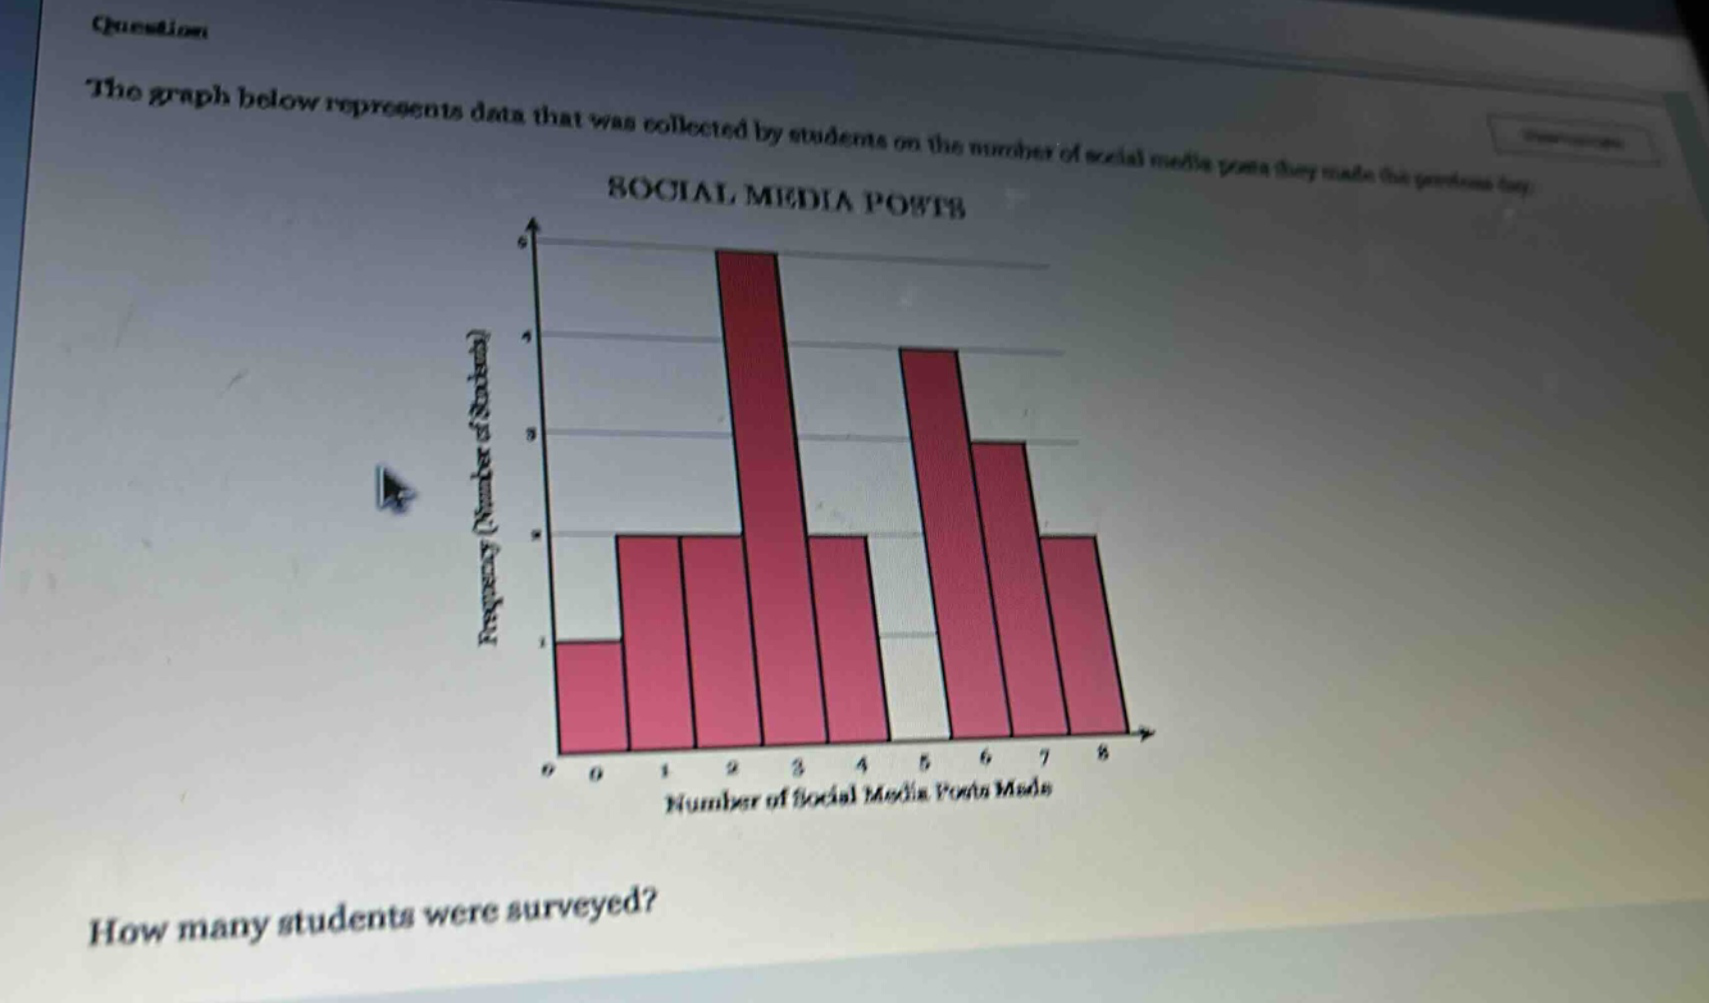
the graph below represents data that was collected by students on the number of social media posts they made the previous day. social media posts how many students were surveyed?
Answer
Explanation:
Step1: Identify frequencies
Read the frequencies from the bar - graph for each number of social media posts. Frequencies are 1, 2, 2, 6, 2, 4, 3, 2.
Step2: Sum the frequencies
Add all the frequencies together: $1 + 2+2 + 6+2 + 4+3 + 2$. $1+2 = 3$, $3+2 = 5$, $5+6 = 11$, $11+2 = 13$, $13+4 = 17$, $17+3 = 20$, $20+2 = 22$.
Answer:
22