the graph represents a distribution of data. what is the mean of the data? 5 10 30 50
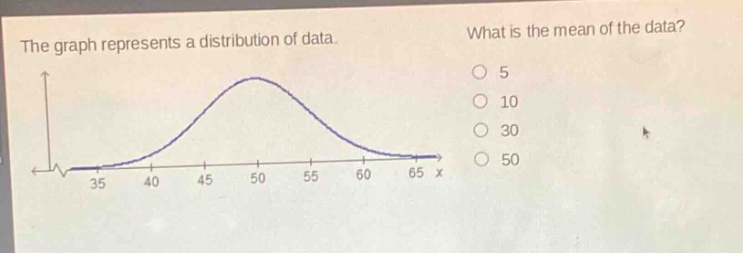
the graph represents a distribution of data. what is the mean of the data? 5 10 30 50
Answer
Answer:
50
Explanation:
Step1: Identify distribution type
The graph is a normal - distribution curve.
Step2: Recall property of normal distribution
In a normal distribution, the mean, median, and mode are equal.
Step3: Locate peak of curve
The peak of the normal - distribution curve occurs at the mean. Here, the peak is at (x = 50). So the mean of the data is 50.