the graph represents the distribution of the lengths of play times, in minutes, for songs played by a radio…
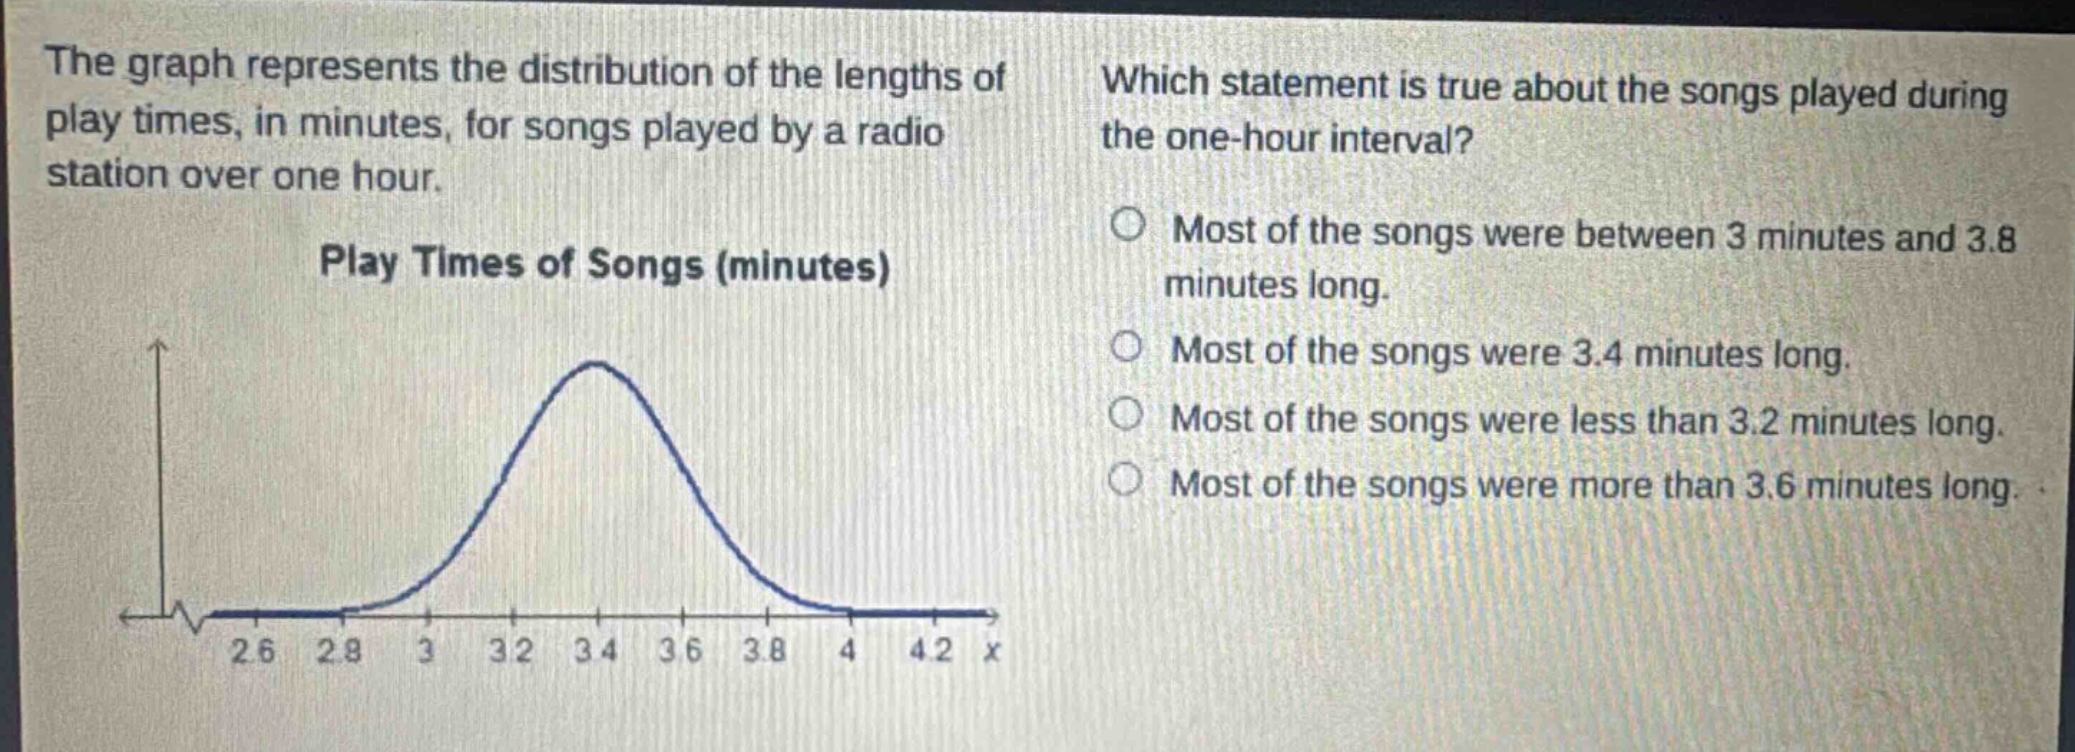
the graph represents the distribution of the lengths of play times, in minutes, for songs played by a radio station over one hour. play times of songs (minutes) which statement is true about the songs played during the one - hour interval? most of the songs were between 3 minutes and 3.8 minutes long. most of the songs were 3.4 minutes long. most of the songs were less than 3.2 minutes long. most of the songs were more than 3.6 minutes long.
Answer
Explanation:
Step1: Identify peak of distribution
The peak of the distribution (highest - point of the curve) is in the interval between 3.2 and 3.6 minutes. This indicates the most common play - times of the songs.
Step2: Analyze options
- Option 1: The interval 3 - 3.8 minutes contains the peak of the distribution. Since the peak represents the most common values, most of the songs were between 3 minutes and 3.8 minutes long.
- Option 2: The graph is a distribution, not all songs are 3.4 minutes long. There is a spread of values.
- Option 3: The peak is not in the region less than 3.2 minutes.
- Option 4: The peak is not in the region more than 3.6 minutes.
Answer:
Most of the songs were between 3 minutes and 3.8 minutes long.