the graph represents the distribution of the number of questions answered correctly on a 50 - question math…
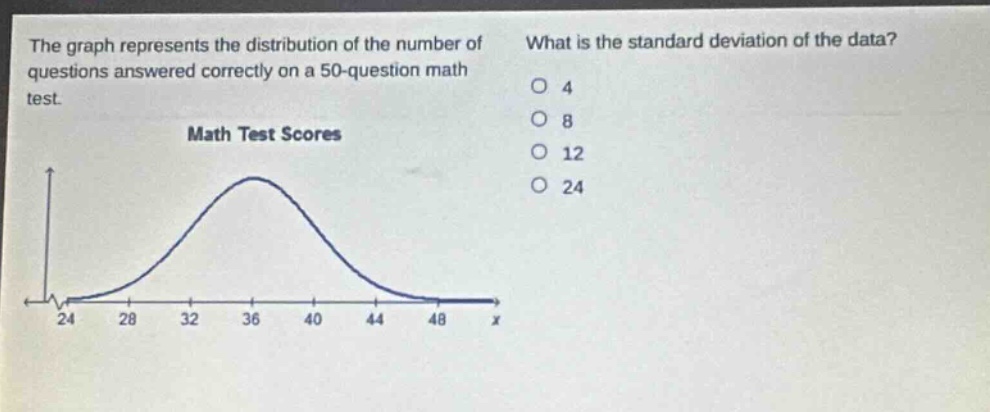
the graph represents the distribution of the number of questions answered correctly on a 50 - question math test. what is the standard deviation of the data? math test scores 4 8 12 24 24 28 32 36 40 44 48 x
Answer
Explanation:
Step1: Recall normal - distribution property
In a normal distribution, approximately 95% of the data lies within 2 standard deviations of the mean. If we assume the mean is around 36 (the peak of the curve) and we consider the interval from 28 to 44 (where most of the data seems to be concentrated).
Step2: Calculate standard - deviation
The range from 28 to 44 is symmetric about the mean. The distance from the mean to either end of this interval is (36 - 28=8) or (44 - 36 = 8). Since this distance represents 2 standard deviations ((2\sigma)) in a normal - distribution, we can find the standard deviation (\sigma) by the formula (\sigma=\frac{\text{distance}}{2}). So, (\sigma=\frac{8}{2}=4).
Answer:
4