the graph represents the distribution of the number of questions answered correctly on a 50 - question math…
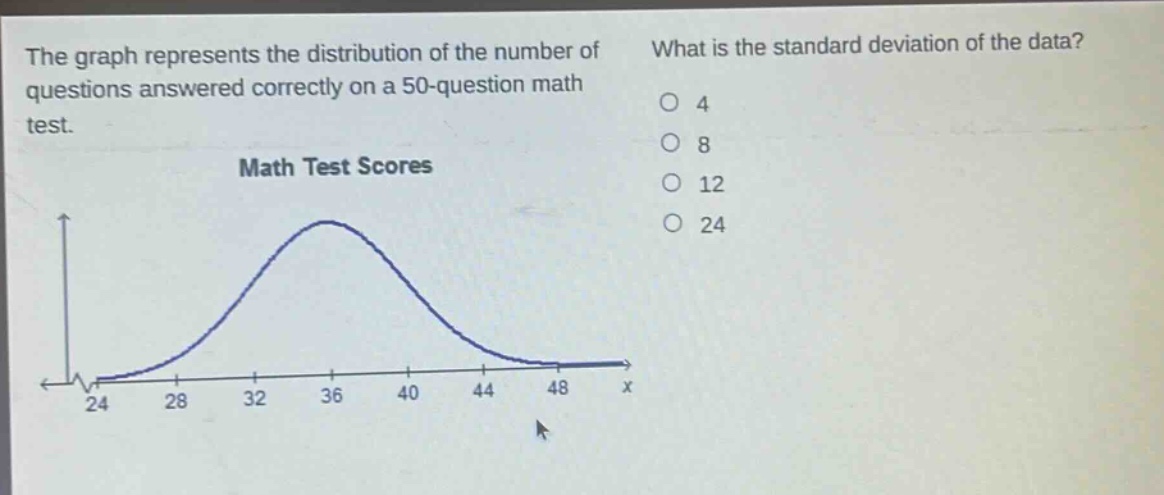
the graph represents the distribution of the number of questions answered correctly on a 50 - question math test. what is the standard deviation of the data? 4 8 12 24 math test scores
Answer
Explanation:
Step1: Recall normal - distribution property
In a normal distribution, approximately 68% of the data lies within 1 standard - deviation of the mean, 95% within 2 standard - deviations, and 99.7% within 3 standard - deviations. If we assume the mean is around 36 (the peak of the bell - curve) and we consider the range where a significant portion of the data lies. For a normal distribution, we can estimate the standard deviation by looking at the spread of the data. A common way is to note that about 95% of the data lies within the interval ((\mu - 2\sigma,\mu + 2\sigma)). If we assume the mean (\mu\approx36) and we consider the range from approximately 28 to 44 as containing about 95% of the data.
Step2: Calculate standard deviation
We know that if the interval ((\mu - 2\sigma,\mu + 2\sigma)) is from 28 to 44 and (\mu\approx36), then (\mu - 2\sigma=28) and (\mu + 2\sigma = 44). Using (\mu - 2\sigma=28) and substituting (\mu = 36), we get (36-2\sigma=28). Solving for (\sigma): [ \begin{align*} 36-2\sigma&=28\ -2\sigma&=28 - 36\ -2\sigma&=-8\ \sigma& = 4 \end{align*} ]
Answer:
4