the graph represents the distribution of the number of questions answered correctly on a 50 - question math…
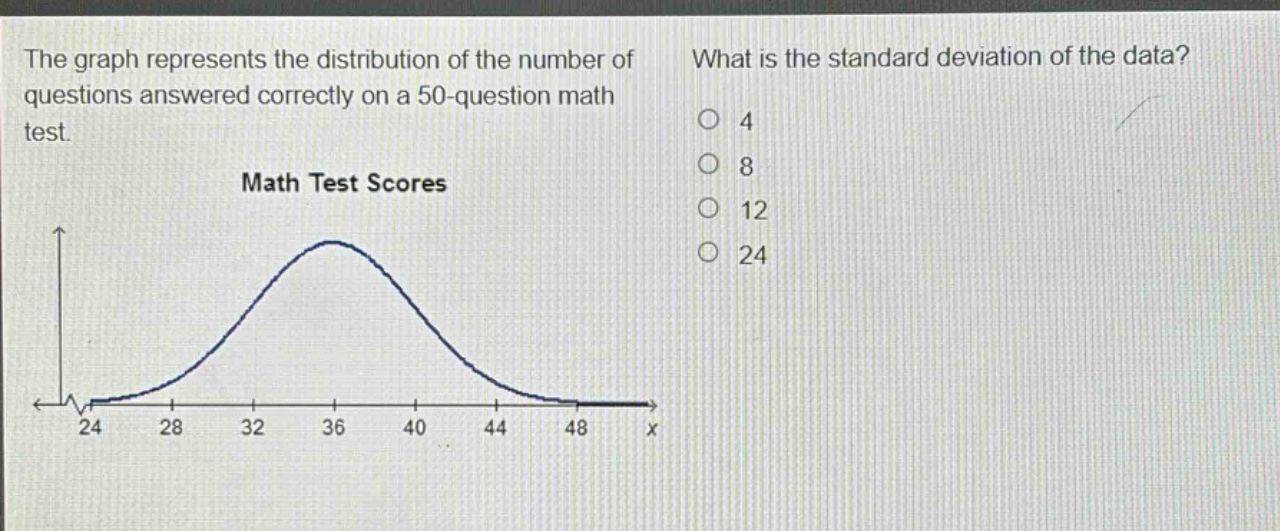
the graph represents the distribution of the number of questions answered correctly on a 50 - question math test. what is the standard deviation of the data? 4 8 12 24 math test scores 24 28 32 36 40 44 48 x
Answer
Explanation:
Step1: Recall normal - distribution property
In a normal distribution, approximately 68% of the data lies within 1 standard - deviation of the mean, 95% within 2 standard - deviations, and 99.7% within 3 standard - deviations. If the mean is around 36 and one of the common points on a normal distribution curve that we can use for estimation is when we move 1 standard - deviation away from the mean. Looking at the graph, if we assume the mean is 36, and we know that a common feature is that the inflection points of the normal curve are at a distance of 1 standard - deviation from the mean. If we consider the distance from the mean to a point where the curvature changes, we can estimate the standard - deviation. The distance from 36 to 40 (or 36 to 32) seems to be a reasonable estimate for 1 standard - deviation.
Step2: Calculate the difference
The difference between the mean (assumed 36) and 40 (or 32) is (40 - 36=4) (or (36 - 32 = 4)). So, the standard - deviation of the data is likely 4.
Answer:
4