the graph below represents how long it takes students in a 6th grade math class to get to school every…
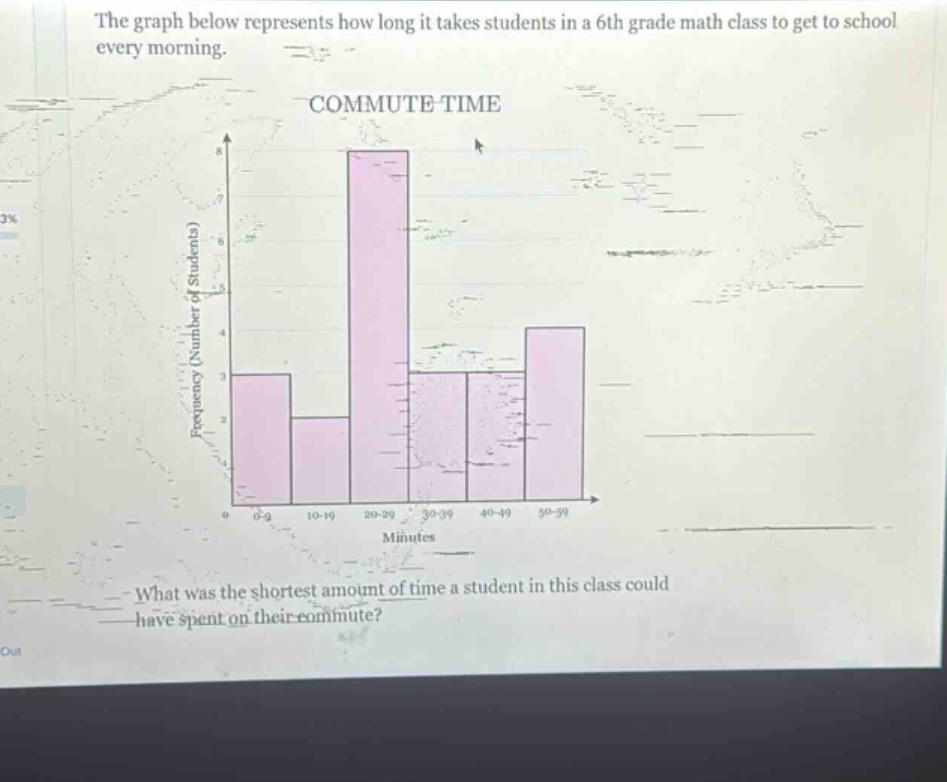
the graph below represents how long it takes students in a 6th grade math class to get to school every morning. commute time what was the shortest amount of time a student in this class could have spent on their commute?
Answer
Explanation:
Step1: Analyze the bar - graph intervals
The intervals for commute time are 0 - 9, 10 - 19, 20 - 29, 30 - 39, 40 - 49, 50 - 59 minutes.
Step2: Determine the shortest interval
The shortest interval is 0 - 9 minutes. The lower - bound of this interval represents the shortest possible commute time. So the shortest amount of time a student could have spent on their commute is 0 minutes.
Answer:
0 minutes