the graph represents a mechanics labor costs for a given number of hours of car repair.\ncar repairs\nwhich…
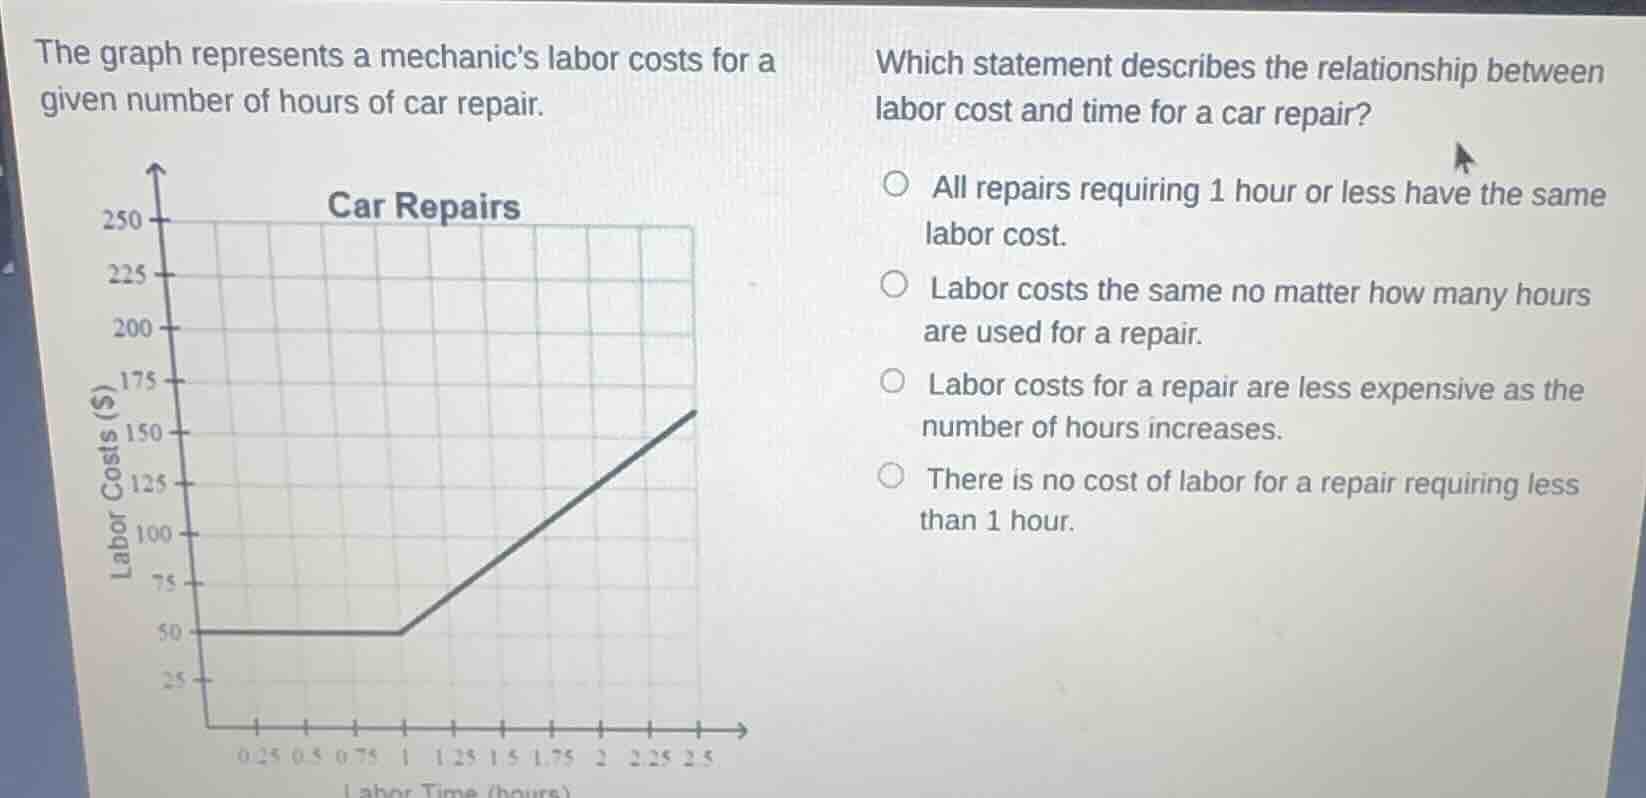
the graph represents a mechanics labor costs for a given number of hours of car repair.\ncar repairs\nwhich statement describes the relationship between labor cost and time for a car repair?\nall repairs requiring 1 hour or less have the same labor cost.\nlabor costs the same no matter how many hours are used for a repair.\nlabor costs for a repair are less expensive as the number of hours increases.\nthere is no cost of labor for a repair requiring less than 1 hour.
Answer
Brief Explanations:
- Analyze the first option: The graph shows that for labor time from 0 to 1 hour, the labor cost is constant at $50. So repairs taking 1 hour or less (i.e., 0 - 1 hour) have the same labor cost.
- Analyze the second option: After 1 hour, the cost increases with time, so labor cost is not the same for all hours. Eliminate this.
- Analyze the third option: After 1 hour, as time increases, cost increases (the line has a positive slope), so labor cost is more expensive with more hours. Eliminate this.
- Analyze the fourth option: For time less than 1 hour, the cost is $50, not zero. Eliminate this.
Answer:
A. All repairs requiring 1 hour or less have the same labor cost.