the graph represents the normal distribution of recorded weights, in pounds, of cats at a veterinary clinic…
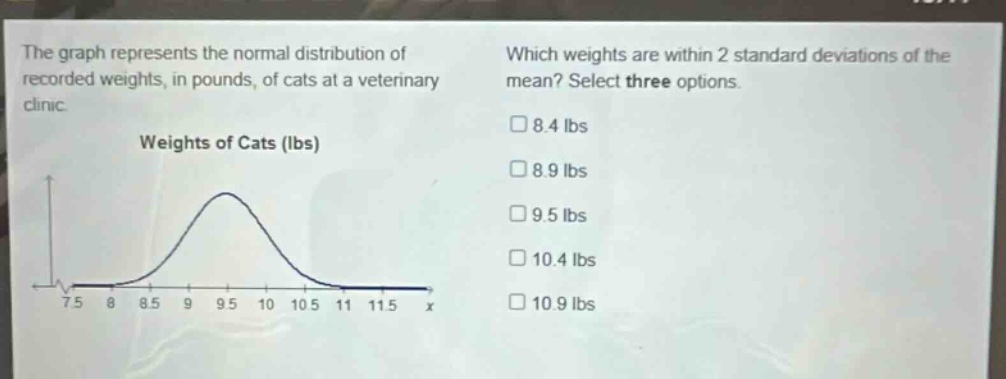
the graph represents the normal distribution of recorded weights, in pounds, of cats at a veterinary clinic. which weights are within 2 standard deviations of the mean? select three options. weights of cats (lbs) 8.4 lbs 8.9 lbs 9.5 lbs 10.4 lbs 10.9 lbs
Answer
Explanation:
Step1: Recall normal - distribution property
In a normal distribution, values within 2 standard deviations of the mean are in the interval $(\mu - 2\sigma,\mu + 2\sigma)$. From the graph, assume the mean $\mu = 9.5$ and the standard - deviation $\sigma=0.5$. Then the interval is $(9.5 - 2\times0.5,9.5 + 2\times0.5)=(8.5,10.5)$.
Step2: Check each option
- For 8.4 lbs: Since $8.4<8.5$, it is not within the interval.
- For 8.9 lbs: Since $8.5 < 8.9<10.5$, it is within the interval.
- For 9.5 lbs: Since $8.5 < 9.5<10.5$, it is within the interval.
- For 10.4 lbs: Since $8.5 < 10.4<10.5$, it is within the interval.
- For 10.9 lbs: Since $10.9>10.5$, it is not within the interval.
Answer:
8.9 lbs, 9.5 lbs, 10.4 lbs