the graph below represents the number of goals scored by the girls soccer team in every game so far this…
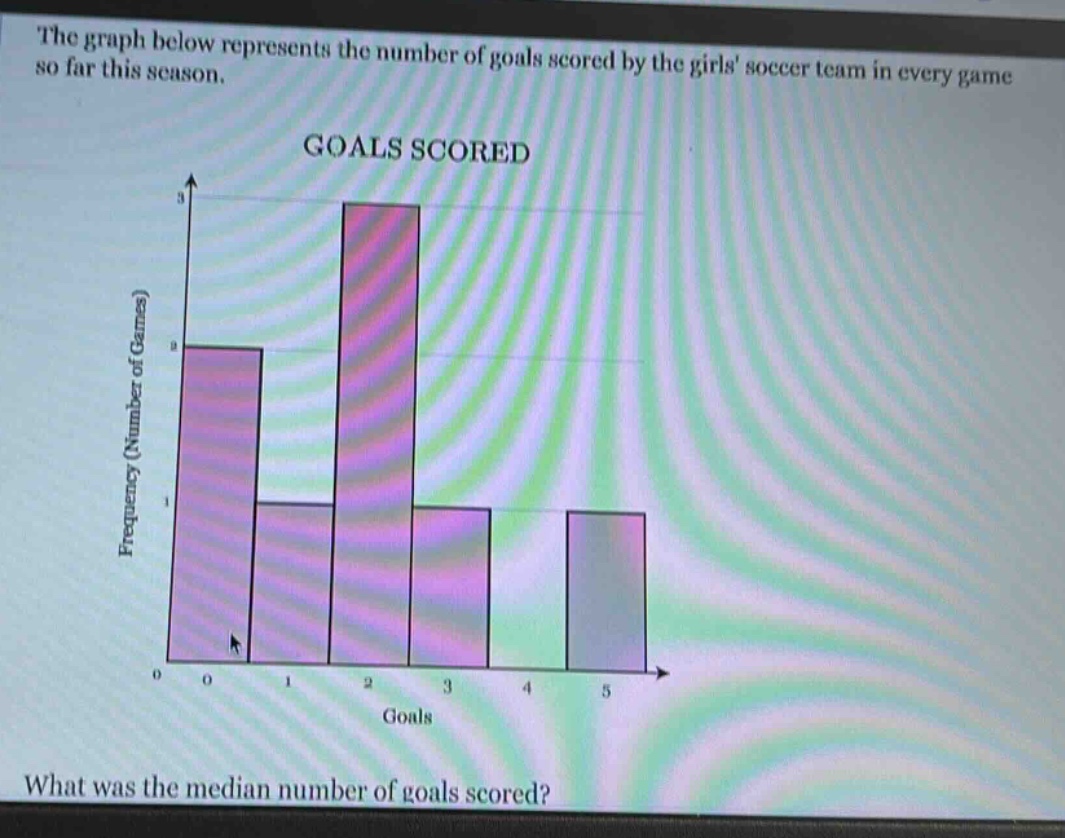
the graph below represents the number of goals scored by the girls soccer team in every game so far this season.\ngoals scored\nwhat was the median number of goals scored?
Answer
Explanation:
Step1: Find total number of data - points
Add the frequencies: $2 + 1+3 + 1+1=8$.
Step2: Determine position of median
Since $n = 8$ (even), the median is the average of the $\frac{n}{2}$-th and $(\frac{n}{2}+1)$-th ordered data - points. $\frac{n}{2}=\frac{8}{2}=4$ and $\frac{n}{2}+1 = 5$.
Step3: Order data and find median
Order the number of goals by frequency. The first 2 data - points have 0 goals, the next 1 has 1 goal, the next 3 have 2 goals, the next 1 has 3 goals and the last 1 has 5 goals. The 4th and 5th ordered data - points are both 2. The average of 2 and 2 is $\frac{2 + 2}{2}=2$.
Answer:
2