the graph below represents results of a survey in which students stated the number of minutes theyd spent…
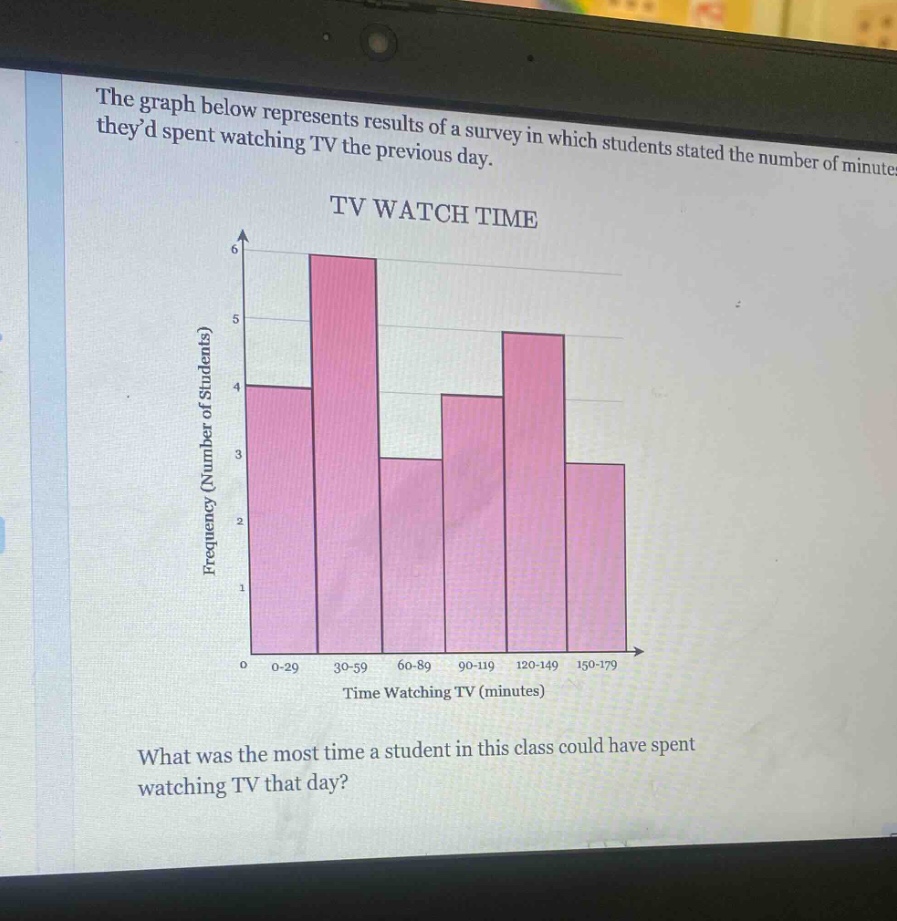
the graph below represents results of a survey in which students stated the number of minutes theyd spent watching tv the previous day. tv watch time what was the most time a student in this class could have spent watching tv that day?
Answer
Explanation:
Step1: Identify the last interval
The last time - watching TV interval is 150 - 179 minutes.
Step2: Determine the maximum value
The maximum value in the 150 - 179 minutes interval is 179 minutes.
Answer:
179 minutes