the graph below represents results of a survey in which students stated the number of minutes theyd spent…
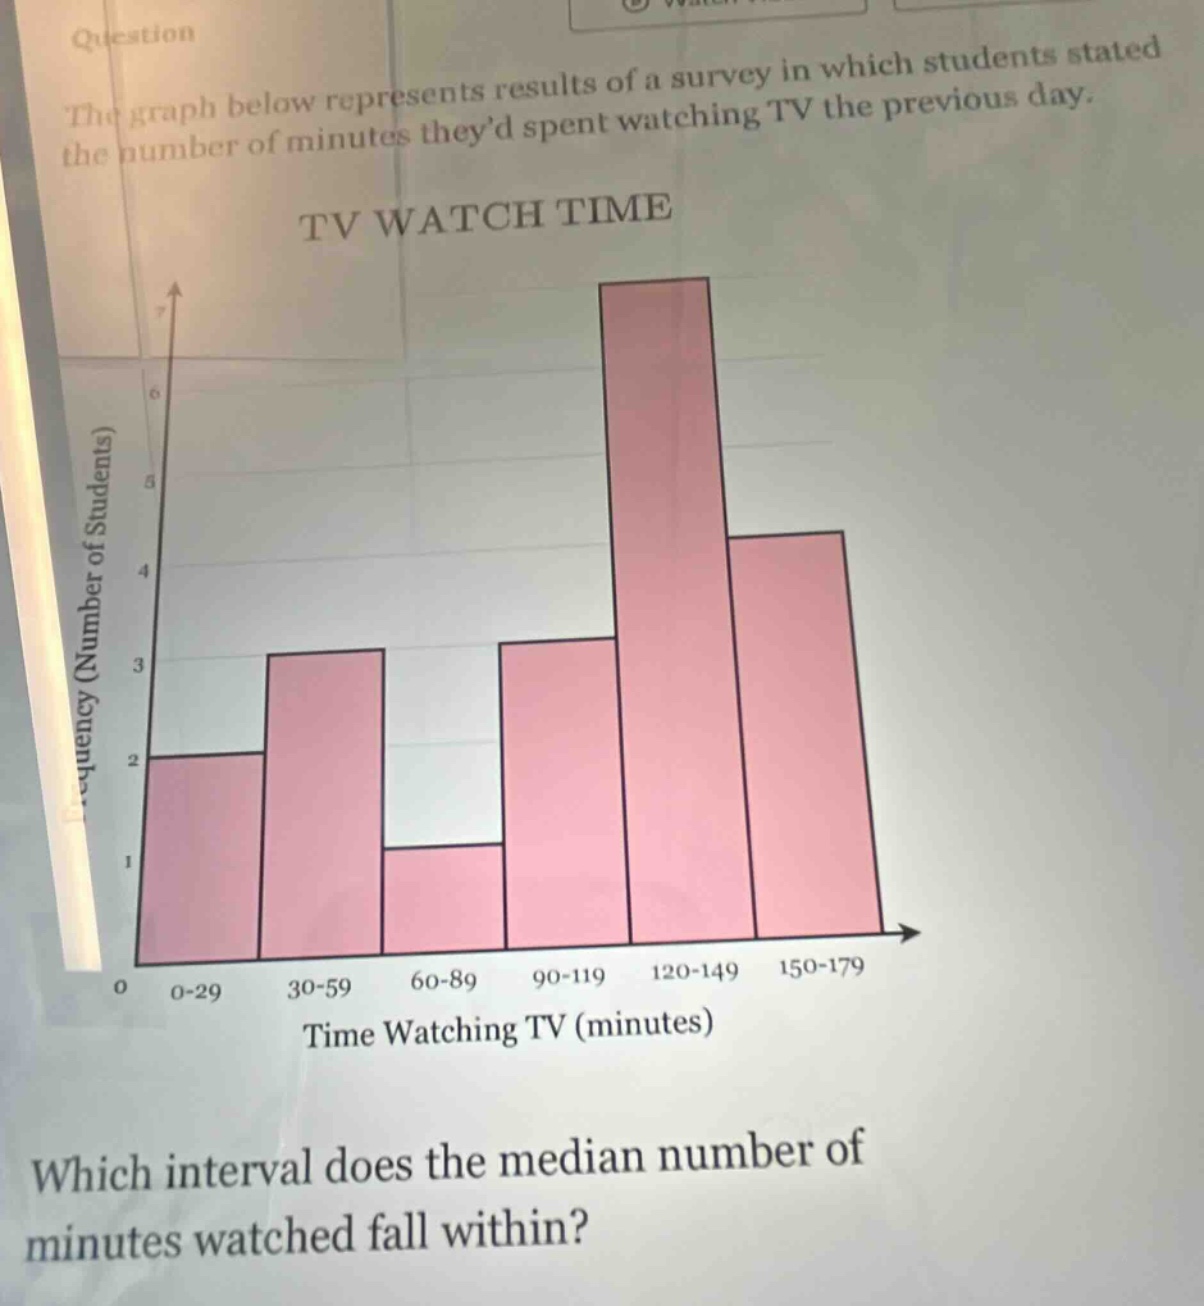
the graph below represents results of a survey in which students stated the number of minutes theyd spent watching tv the previous day. tv watch time which interval does the median number of minutes watched fall within?
Answer
Explanation:
Step1: Calculate the total number of students surveyed.
Sum the frequencies (number of students) for each interval shown in the histogram. $$ N = 2 + 3 + 1 + 3 + 7 + 4 = 20 $$
Step2: Determine the position of the median value.
Since the total number of students (N=20) is even, the median is the average of the values at the $\frac{N}{2}$th and $(\frac{N}{2} + 1)$th positions. $$ \text{Median Positions} = \frac{20}{2} = 10^{th} \text{ and } \frac{20}{2} + 1 = 11^{th} $$ The median falls between the 10th and 11th student's data point when ordered.
Step3: Calculate the cumulative frequency for each interval.
Find the running total of frequencies to locate the median positions.
| Interval | Frequency | Cumulative Frequency |
|---|---|---|
| 0-29 | 2 | 2 |
| 30-59 | 3 | 2 + 3 = 5 |
| 60-89 | 1 | 5 + 1 = 6 |
| 90-119 | 3 | 6 + 3 = 9 |
| 120-149 | 7 | 9 + 7 = 16 |
| 150-179 | 4 | 16 + 4 = 20 |
Step4: Identify the interval containing the median positions.
The 10th and 11th data points fall within the interval where the cumulative frequency first exceeds or equals 11. The cumulative frequency up to the 90-119 interval is 9. The cumulative frequency up to the 120-149 interval is 16. Therefore, the 10th and 11th students fall within the 120-149 minutes interval.
Answer:
120-149