the graph below represents the speeds of kael and lynn as they run around a track. for how many minutes did…
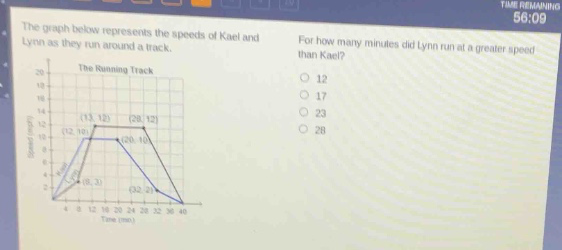
the graph below represents the speeds of kael and lynn as they run around a track. for how many minutes did lynn run at a greater speed than kael? the running track 12 17 23 28
Answer
Explanation:
Step1: Identify the time - intervals
We need to find the time - intervals where Lynn's speed graph is above Kael's speed graph.
Step2: Analyze the graph
The x - axis represents time in minutes and the y - axis represents speed. Lynn's speed is greater than Kael's speed from (t = 13) minutes to (t = 30) minutes.
Step3: Calculate the time difference
The time difference (\Delta t=30 - 13=17) minutes.
Answer:
17