the graph on the right shows the theoretical probability of getting a given number heads in ten flips of a…
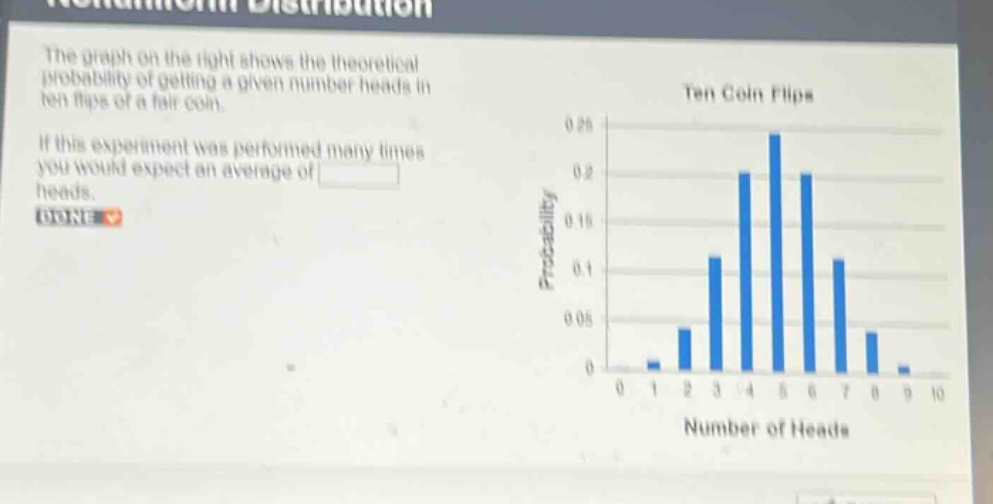
the graph on the right shows the theoretical probability of getting a given number heads in ten flips of a fair coin. if this experiment was performed many times you would expect an average of heads. done
Answer
Answer:
5
Explanation:
Step1: Recall binomial distribution formula
The number of heads (X) in (n) coin - flips of a fair coin follows a binomial distribution (X\sim B(n,p)), where (n = 10) (number of trials) and (p=0.5) (probability of getting a head in a single fair - coin flip).
Step2: Use the formula for the mean of a binomial distribution
The mean (expected value) of a binomial distribution (E(X)=np). Substitute (n = 10) and (p = 0.5) into the formula: (E(X)=10\times0.5=5). So, if the experiment of ten coin - flips is performed many times, we would expect an average of 5 heads.