the graph shows the ages of different concert - goers who have backstage passes. which statement is true…
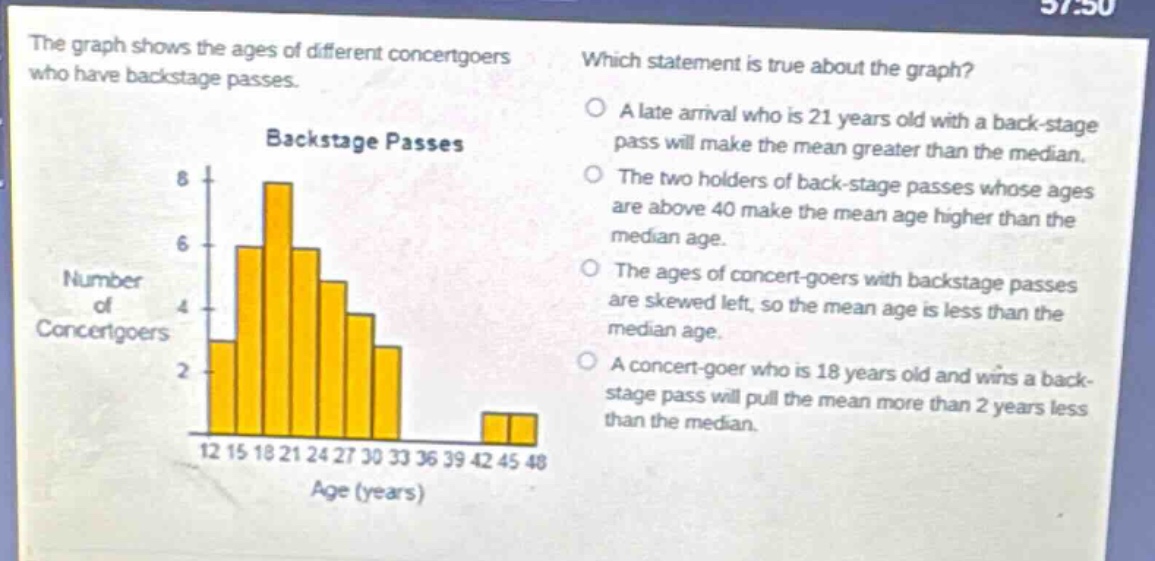
the graph shows the ages of different concert - goers who have backstage passes. which statement is true about the graph? a late arrival who is 21 years old with a back - stage pass will make the mean greater than the median. the two holders of back - stage passes whose ages are above 40 make the mean age higher than the median age. the ages of concert - goers with backstage passes are skewed left, so the mean age is less than the median age. a concert - goer who is 18 years old and wins a back - stage pass will pull the mean more than 2 years less than the median.
Answer
Explanation:
Step1: Understand mean and median concepts
Mean is the average value, median is the middle - value when data is ordered.
Step2: Analyze the skewness of the data
The data has a right - skew as there are a few high values (ages above 40). In a right - skewed distribution, the mean is pulled in the direction of the tail (higher values), so the mean is greater than the median.
Step3: Evaluate each option
- Option A: A 21 - year - old is in the main cluster of data, won't make mean > median.
- Option B: The two holders above 40 (right - tail values) pull the mean up, making mean > median. This is correct.
- Option C: The data is skewed right, not left.
- Option D: An 18 - year - old is in the main cluster, won't pull mean much relative to median.
Answer:
The two holders of back - stage passes whose ages are above 40 make the mean age higher than the median age.