the graph shows the ages of different concert - goers who have backstage passes. which statement is true…
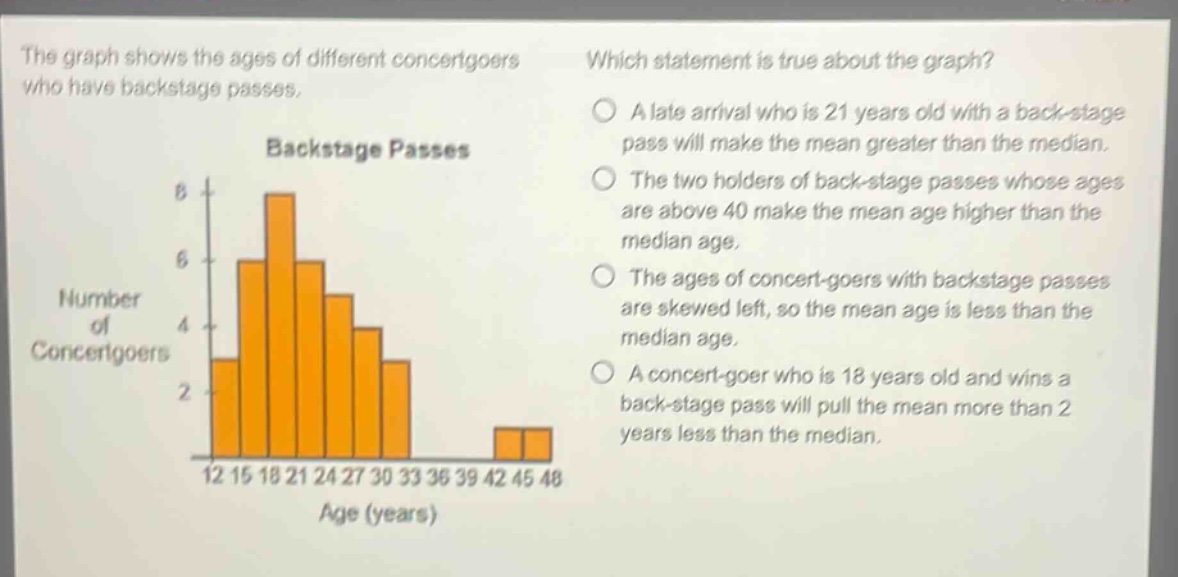
the graph shows the ages of different concert - goers who have backstage passes. which statement is true about the graph? a late arrival who is 21 years old with a back - stage pass will make the mean greater than the median. the two holders of back - stage passes whose ages are above 40 make the mean age higher than the median age. the ages of concert - goers with backstage passes are skewed left, so the mean age is less than the median age. a concert - goer who is 18 years old and wins a back - stage pass will pull the mean more than 2 years less than the median. backstage passes 12 15 18 21 24 27 30 33 36 39 42 45 48 age (years) 8 6 4 2 number of concertgoers
Answer
Answer: B. The two holders of back - stage passes whose ages are above 40 make the mean age higher than the median age.
Explanation:
Step1: Understand mean and median
Mean is the average value, affected by extreme values. Median is the middle - value when data is ordered.
Step2: Analyze the graph
The ages above 40 are extreme values in this data set. They will increase the mean. Since the median is less affected by extreme values, the mean will be higher than the median due to these high - value data points.