the graph below shows the amount of money left in the schools desk fund, $f$, after $d$ desks have been…
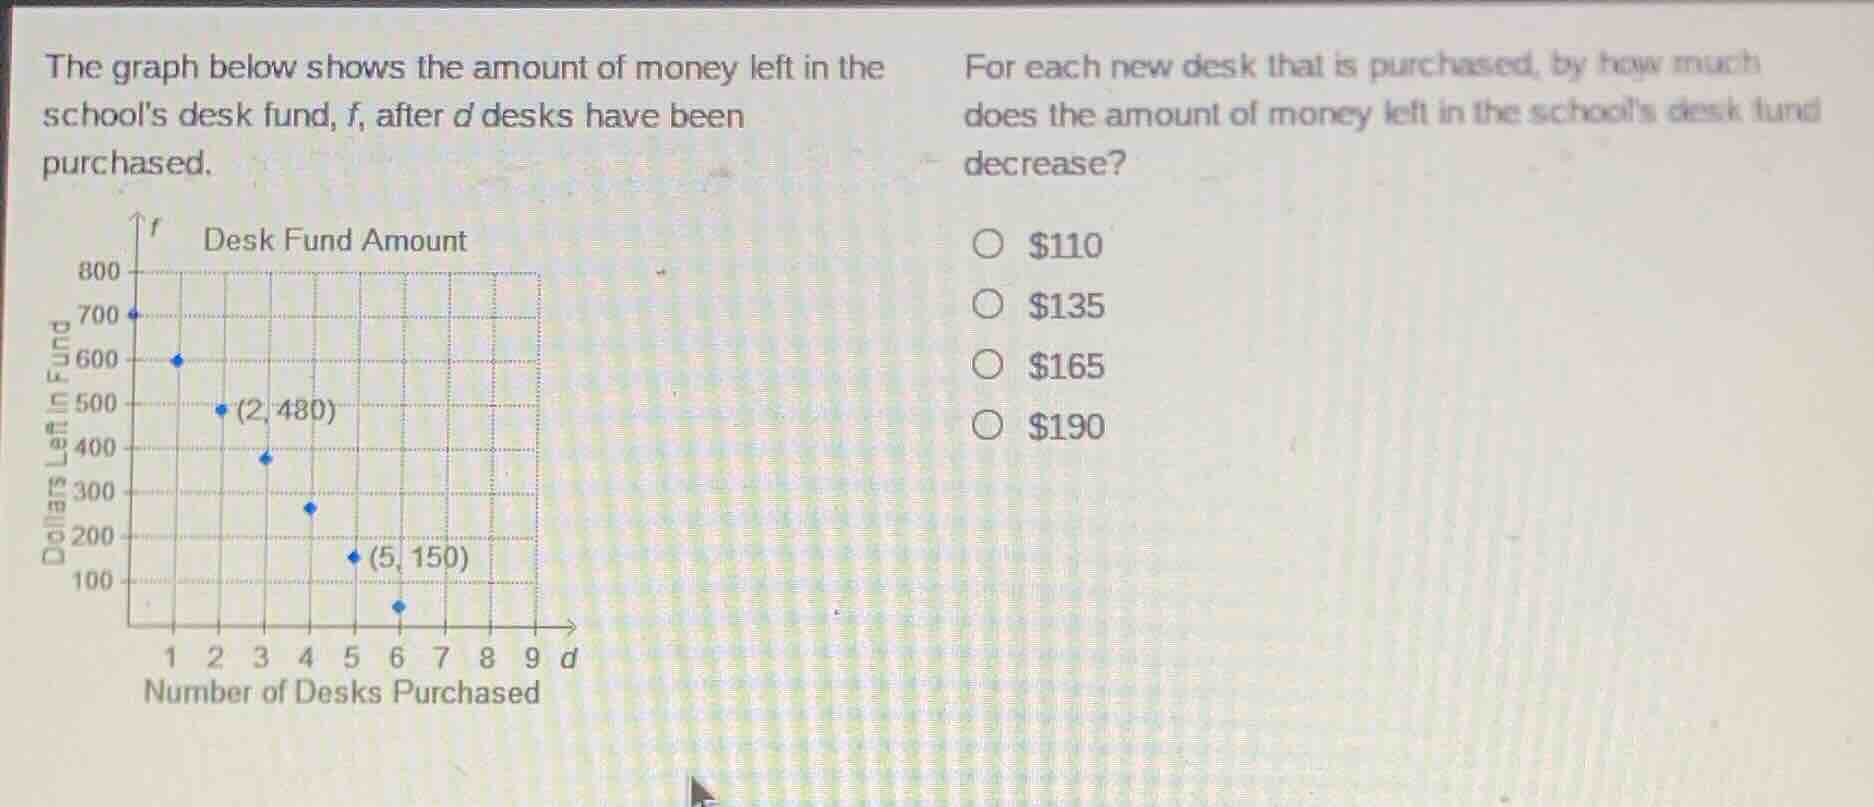
the graph below shows the amount of money left in the schools desk fund, $f$, after $d$ desks have been purchased.\nfor each new desk that is purchased, by how much does the amount of money left in the schools desk fund decrease?\n○ $110\n○ $135\n○ $165\n○ $190
Answer
Explanation:
Step1: Identify two points
Use points $(2, 480)$ and $(5, 150)$
Step2: Calculate total fund decrease
$\text{Total decrease} = 480 - 150 = 330$
Step3: Calculate number of desks added
$\text{Desks added} = 5 - 2 = 3$
Step4: Find per-desk decrease
$\text{Per-desk decrease} = \frac{330}{3} = 110$
Answer:
A. $110