the graph below shows the average daily temperatures on january 1 from 1900 to 1934 for city a. the mean of…
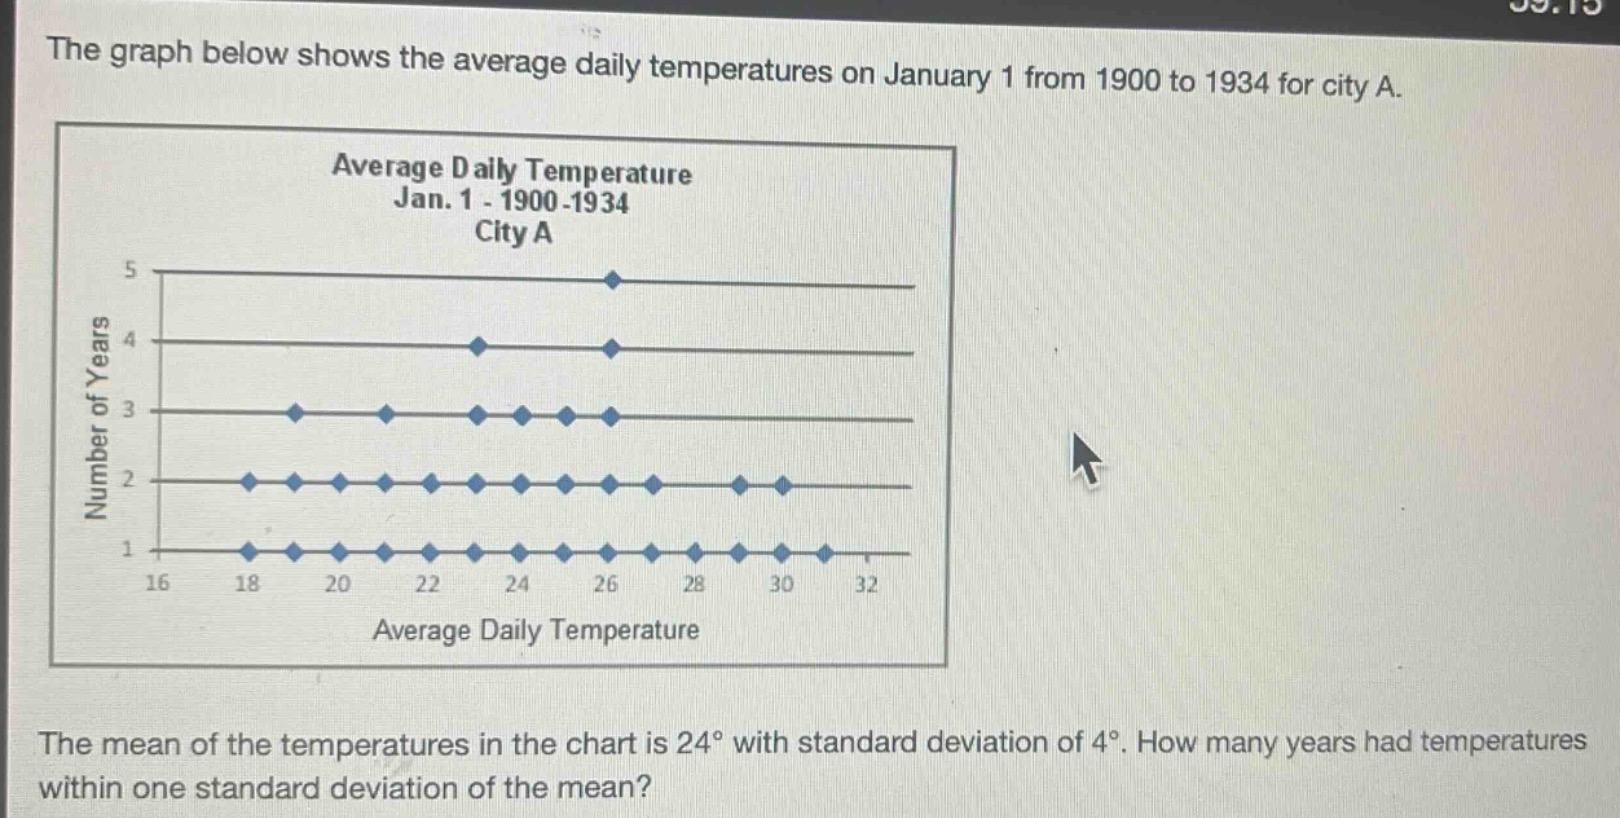
the graph below shows the average daily temperatures on january 1 from 1900 to 1934 for city a. the mean of the temperatures in the chart is 24° with standard deviation of 4°. how many years had temperatures within one standard deviation of the mean?
Answer
Explanation:
Step1: Determine the range
The mean is $\mu = 24^{\circ}$ and the standard - deviation is $\sigma=4^{\circ}$. The range within one standard deviation of the mean is $\mu-\sigma$ to $\mu + \sigma$, so $24 - 4=20^{\circ}$ to $24 + 4 = 28^{\circ}$.
Step2: Count the number of years in the range
Count the number of data - points (represented by the blue dots) in the temperature range of $20^{\circ}$ to $28^{\circ}$ on the graph. From the graph:
- For temperature $20^{\circ}$: 2 years
- For temperature $21^{\circ}$: 2 years
- For temperature $22^{\circ}$: 3 years
- For temperature $23^{\circ}$: 2 years
- For temperature $24^{\circ}$: 3 years
- For temperature $25^{\circ}$: 3 years
- For temperature $26^{\circ}$: 4 years
- For temperature $27^{\circ}$: 2 years
- For temperature $28^{\circ}$: 3 years
The total number of years is $2 + 2+3 + 2+3 + 3+4 + 2+3=24$.
Answer:
24