the graph below shows the average daily temperatures on january 1 from 1900 to 1934 for city a. the mean of…
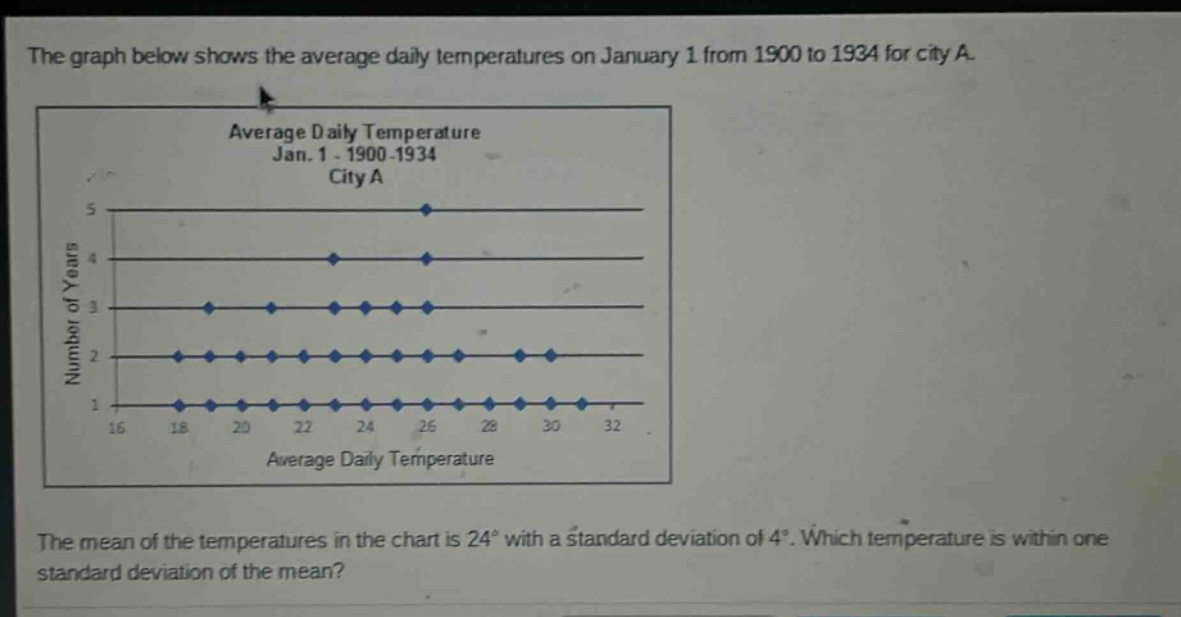
the graph below shows the average daily temperatures on january 1 from 1900 to 1934 for city a. the mean of the temperatures in the chart is 24° with a standard deviation of 4°. which temperature is within one standard deviation of the mean?
Answer
Explanation:
Step1: Determine the range
The range within one - standard deviation of the mean is calculated as $\text{Mean}-\text{Standard Deviation}$ to $\text{Mean}+\text{Standard Deviation}$. Given mean $\mu = 24^{\circ}$ and standard deviation $\sigma=4^{\circ}$, the lower limit is $\mu-\sigma=24 - 4=20^{\circ}$ and the upper limit is $\mu+\sigma=24 + 4 = 28^{\circ}$.
Answer:
Temperatures between $20^{\circ}$ and $28^{\circ}$ (inclusive) are within one standard deviation of the mean.