the graph shows the average price of potatoes per pound starting from january 2014. a student states that…
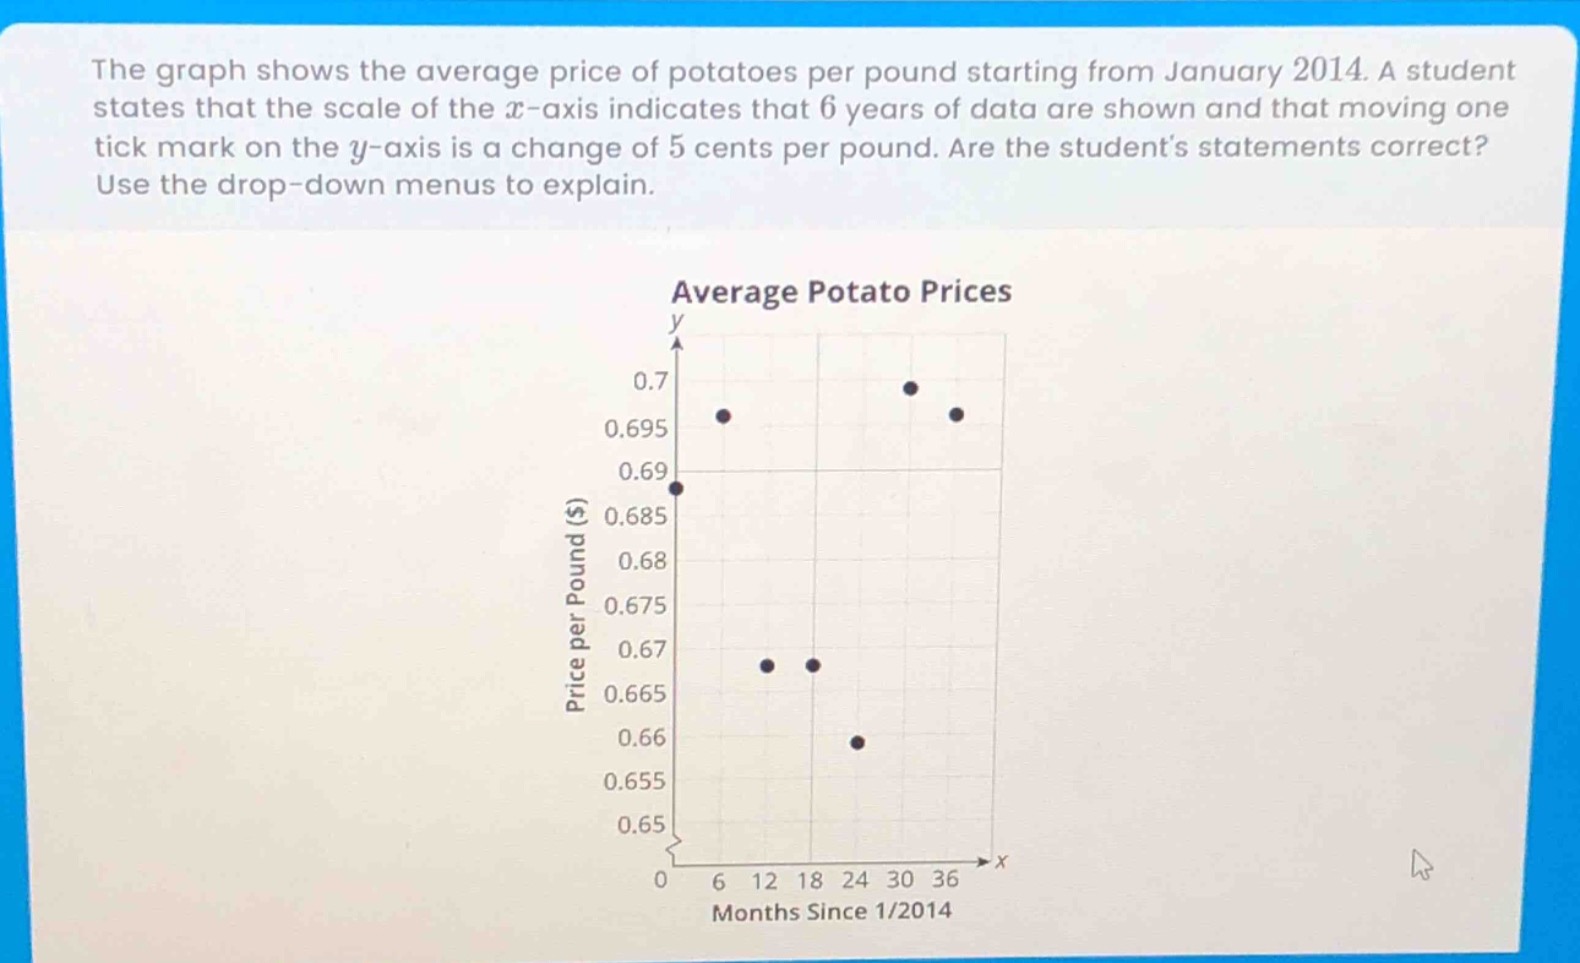
the graph shows the average price of potatoes per pound starting from january 2014. a student states that the scale of the x - axis indicates that 6 years of data are shown and that moving one tick mark on the y - axis is a change of 5 cents per pound. are the students statements correct? use the drop - down menus to explain.\naverage potato prices\nprice per pound ($)\nmonths since 1/2014
Answer
Explanation:
Step1: Analyze x - axis scale
The x - axis is labeled "Months Since 1/2014". The values range from 0 to 36. Since 36 months is 3 years ($\frac{36}{12}=3$), not 6 years.
Step2: Analyze y - axis scale
The y - axis values are 0.65, 0.655, 0.66, 0.665, 0.67, 0.675, 0.68, 0.685, 0.69, 0.695, 0.7. The difference between consecutive tick - marks is 0.005 dollars or 0.5 cents, not 5 cents.
Answer:
No, the student's statements are incorrect.