the graph shows the best - fit regression model for a set of data comparing the number of hours spent hiking…
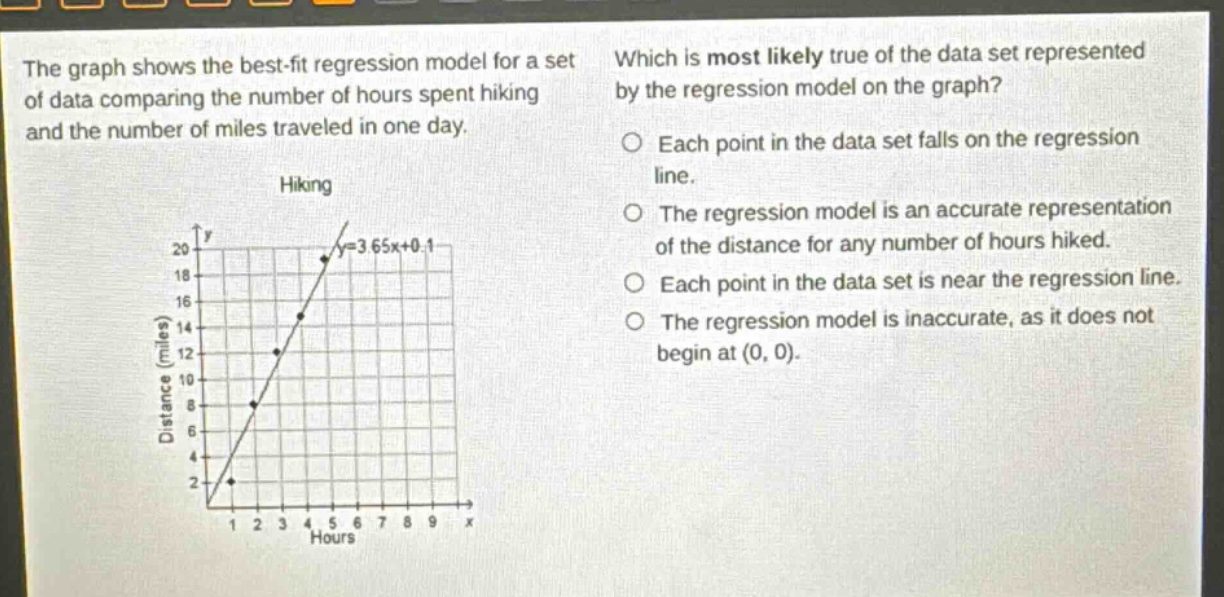
the graph shows the best - fit regression model for a set of data comparing the number of hours spent hiking and the number of miles traveled in one day. hiking which is most likely true of the data set represented by the regression model on the graph? each point in the data set falls on the regression line. the regression model is an accurate representation of the distance for any number of hours hiked. each point in the data set is near the regression line. the regression model is inaccurate, as it does not begin at (0, 0).
Answer
Brief Explanations:
A regression line is a best - fit line. Not all data points fall exactly on it. It gives an approximation. The fact that it doesn't start at (0,0) doesn't necessarily mean it's inaccurate. Usually, data points are near the regression line in a good - fit model.
Answer:
Each point in the data set is near the regression line.