the graph shows the data points in the table and the exponential regression model associated with the data…
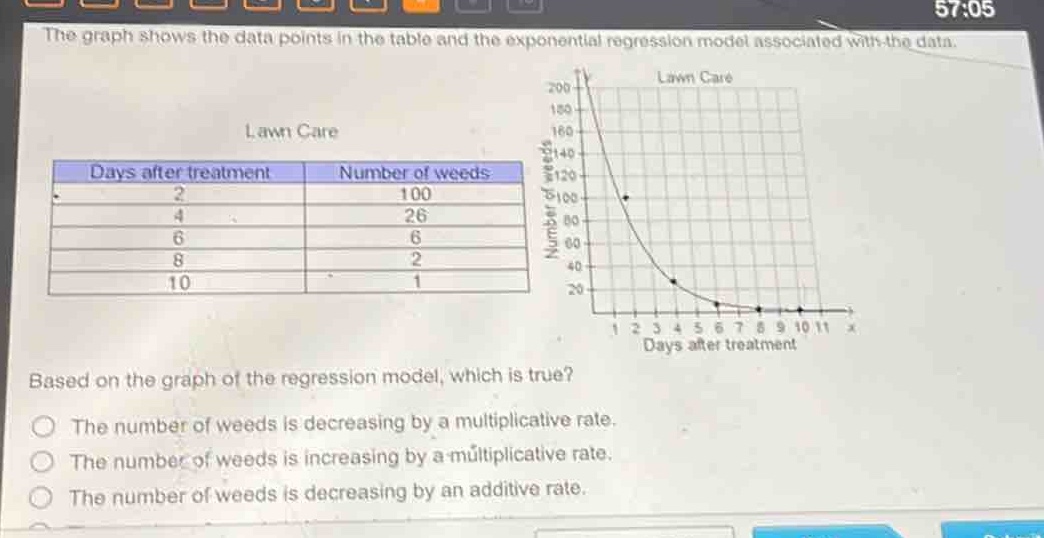
the graph shows the data points in the table and the exponential regression model associated with the data. lawn care days after treatment number of weeds 2 100 4 26 6 6 8 2 10 1 based on the graph of the regression model, which is true? the number of weeds is decreasing by a multiplicative rate. the number of weeds is increasing by a multiplicative rate. the number of weeds is decreasing by an additive rate.
Answer
Answer:
The number of weeds is decreasing by a multiplicative rate.
Explanation:
Step1: Analyze exponential regression
Exponential regression implies multiplicative change.
Step2: Observe data trend
As days increase, number of weeds drops rapidly.
Step3: Determine rate type
This rapid drop is characteristic of multiplicative decrease, not additive.