the graph shows the data of texting speed according to time. use the scatterplot to determine if there is a…
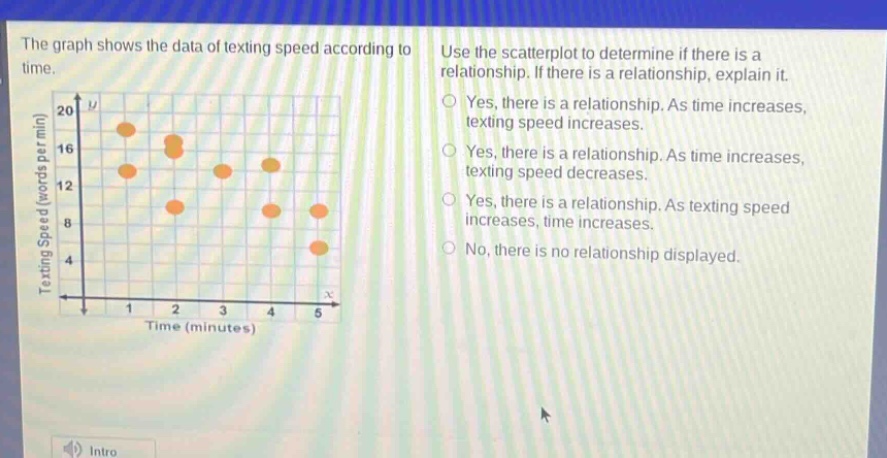
the graph shows the data of texting speed according to time. use the scatterplot to determine if there is a relationship. if there is a relationship, explain it. yes, there is a relationship. as time increases, texting speed increases. yes, there is a relationship. as time increases, texting speed decreases. yes, there is a relationship. as texting speed increases, time increases. no, there is no relationship displayed.
Answer
Brief Explanations:
By observing the scatter - plot, there is no clear upward or downward trend as time increases. The points are randomly scattered.
Answer:
No, there is no relationship displayed.