which graph shows data whose r - value is most likely closest to 1?
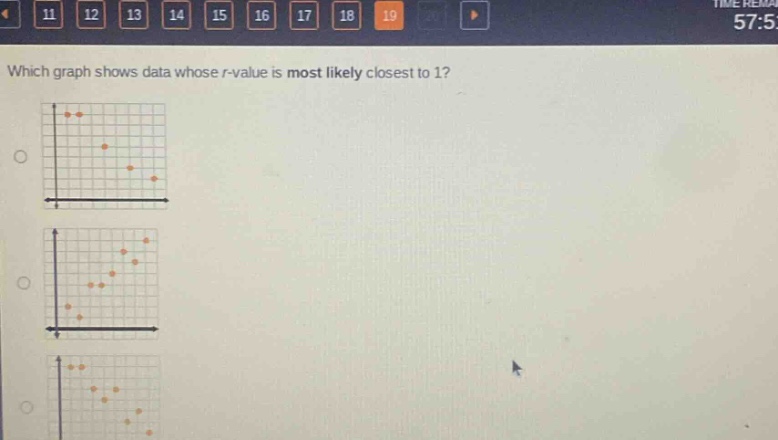
which graph shows data whose r - value is most likely closest to 1?
Answer
Explanation:
Step1: Recall the concept of r - value
The correlation coefficient (r) ranges from - 1 to 1. A value of (r = 1) indicates a perfect positive linear relationship. Points in a perfect positive - linear relationship lie exactly on a straight line with a positive slope. As (r) gets closer to 1, the data points tend to cluster more closely around a straight - line with a positive slope.
Step2: Analyze the graphs
We need to look for a graph where the points are clustered closely around a straight line with a positive slope. In the first graph, the points do not show a clear linear pattern. In the second graph, the points are clustered more closely around a line with a positive slope compared to the others. In the third graph, the points show a negative trend.
Answer:
The second graph (the one where the points are clustered around a line with a positive slope)