which graph shows data whose r - value is most likely closest to 0?
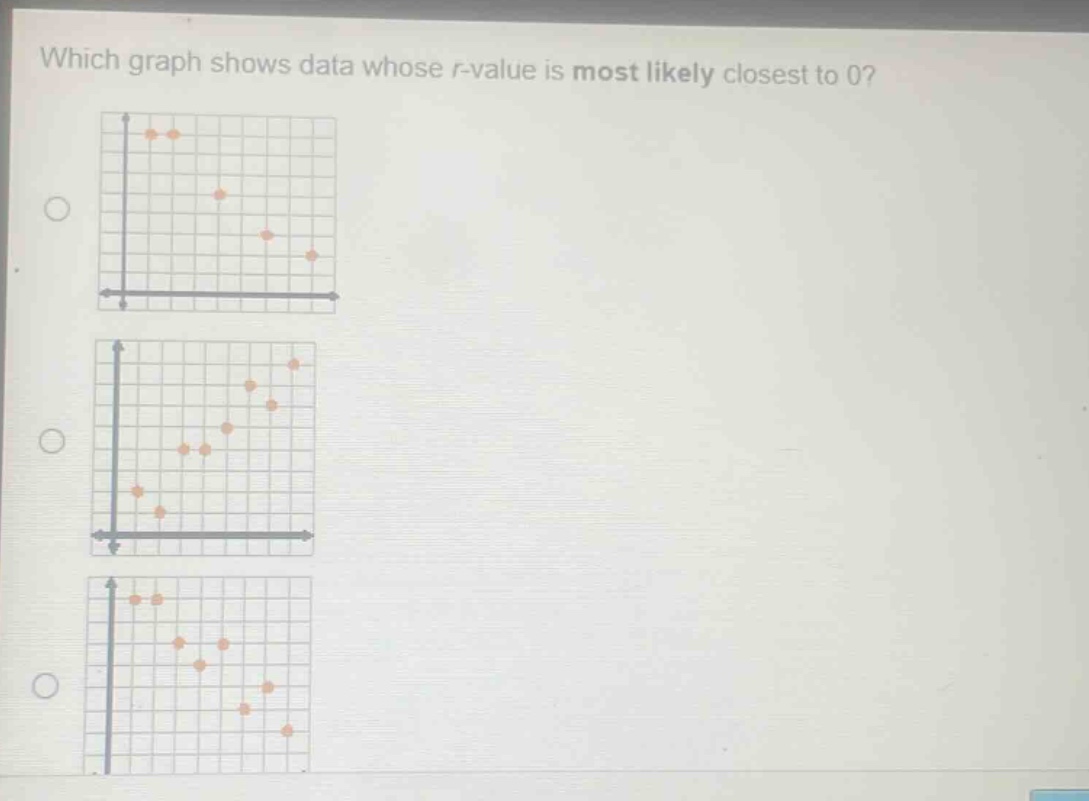
which graph shows data whose r - value is most likely closest to 0?
Answer
Explanation:
Step1: Recall r - value concept
The correlation coefficient (r) measures the strength and direction of a linear relationship. When (r = 0), there is no linear relationship between the variables.
Step2: Analyze scatter - plots
A scatter - plot with points that are randomly scattered and do not form any discernible linear pattern (neither positive - sloping nor negative - sloping) has an (r) - value close to 0.
Answer:
The scatter - plot where the points are randomly distributed without any visible linear trend (either upward or downward) is the one whose (r) - value is most likely closest to 0. Without specific labels for the plots, you should choose the plot with points that do not seem to follow a straight - line path.