which graph shows data whose $r$-value is most likely closest to 1?
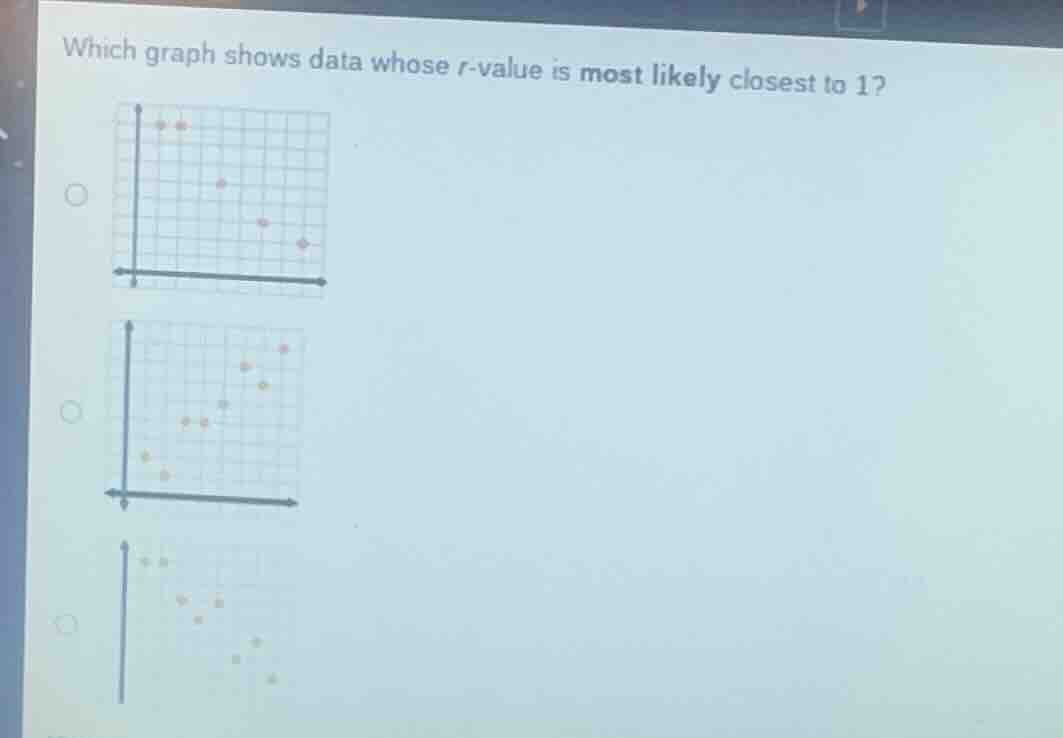
which graph shows data whose $r$-value is most likely closest to 1?
Answer
Explanation:
Step1: Define the correlation coefficient $r$
The $r$-value measures the strength and direction of a linear relationship between two variables.
Step2: Identify characteristics of $r$ close to 1
An $r$-value close to 1 indicates a strong positive linear correlation, where points trend upward from left to right.
Step3: Analyze the first graph
The points trend downward from left to right, indicating a negative correlation ($r < 0$).
Step4: Analyze the second graph
The points trend upward from left to right in a relatively straight line, indicating a strong positive correlation ($r \approx 1$).
Step5: Analyze the third graph
The points trend downward from left to right, indicating a negative correlation ($r < 0$).
Answer:
The second graph (middle option) shows data whose $r$-value is most likely closest to 1.