the graph shows the distribution of the amount of time (in minutes) people spend watching tv shows on a…
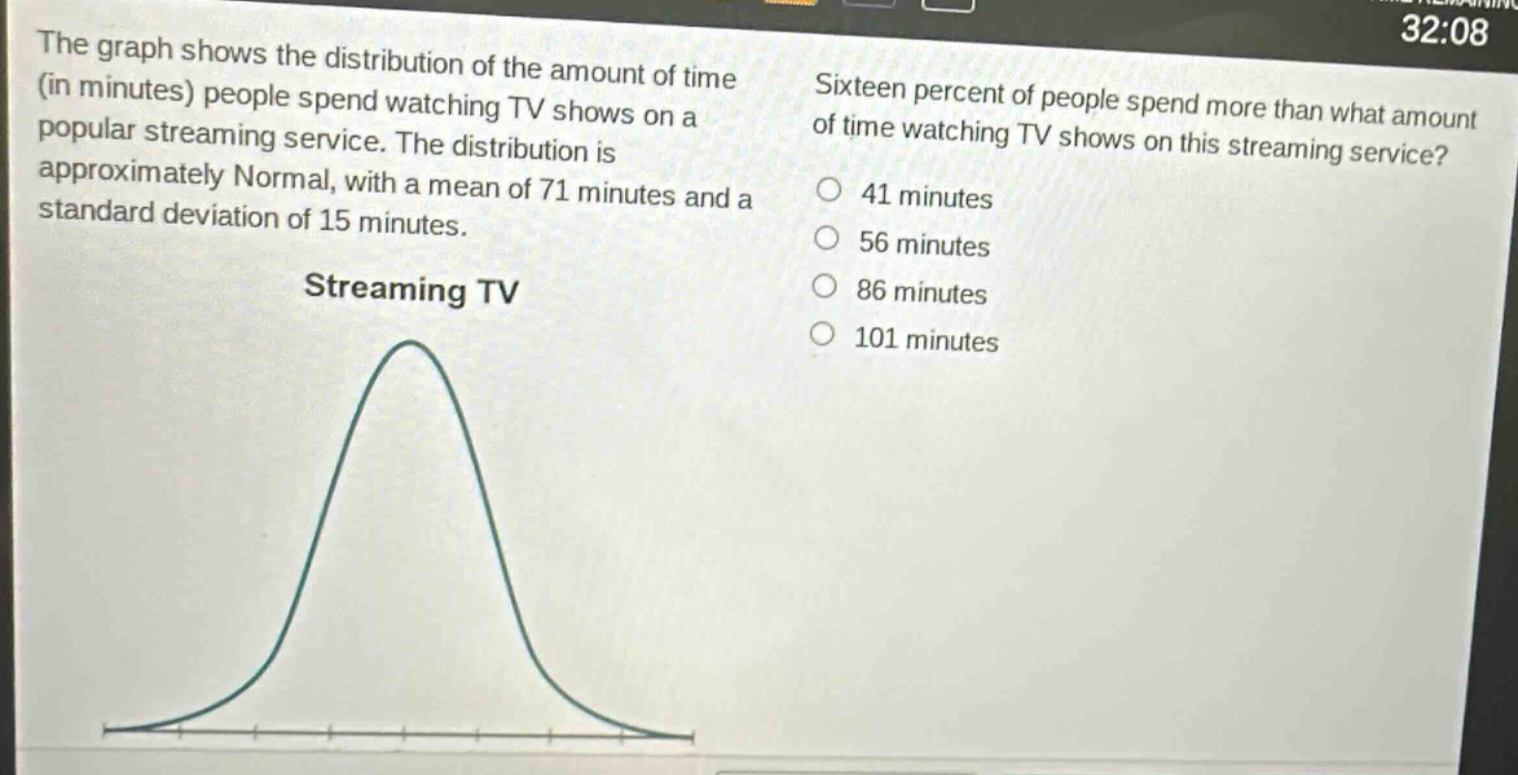
the graph shows the distribution of the amount of time (in minutes) people spend watching tv shows on a popular streaming service. the distribution is approximately normal, with a mean of 71 minutes and a standard deviation of 15 minutes. streaming tv sixteen percent of people spend more than what amount of time watching tv shows on this streaming service? 41 minutes 56 minutes 86 minutes 101 minutes
Answer
Answer:
C. 86 minutes
Explanation:
Step1: Recall the properties of normal distribution
In a normal - distribution, about 68% of the data lies within 1 standard deviation of the mean ($\mu\pm\sigma$), about 95% lies within 2 standard deviations ($\mu\pm2\sigma$), and about 99.7% lies within 3 standard deviations ($\mu\pm3\sigma$). If 16% of people spend more than a certain amount of time, then 84% of people spend less than that amount. Looking at the standard normal distribution table (or using the empirical rule), the z - score corresponding to a cumulative probability of 0.84 is approximately $z = 1$.
Step2: Use the z - score formula
The z - score formula is $z=\frac{x-\mu}{\sigma}$, where $x$ is the value from the data set, $\mu$ is the mean, and $\sigma$ is the standard deviation. We know that $z = 1$, $\mu=71$ minutes, and $\sigma = 15$ minutes. Rearranging the formula for $x$ gives $x=\mu+z\sigma$.
Step3: Calculate the value of $x$
Substitute $\mu = 71$, $z = 1$, and $\sigma=15$ into the formula $x=\mu + z\sigma$. So $x=71+1\times15=86$ minutes.