the graph shows the distribution of the cost of drinks at a popular coffee shop. the distribution is…
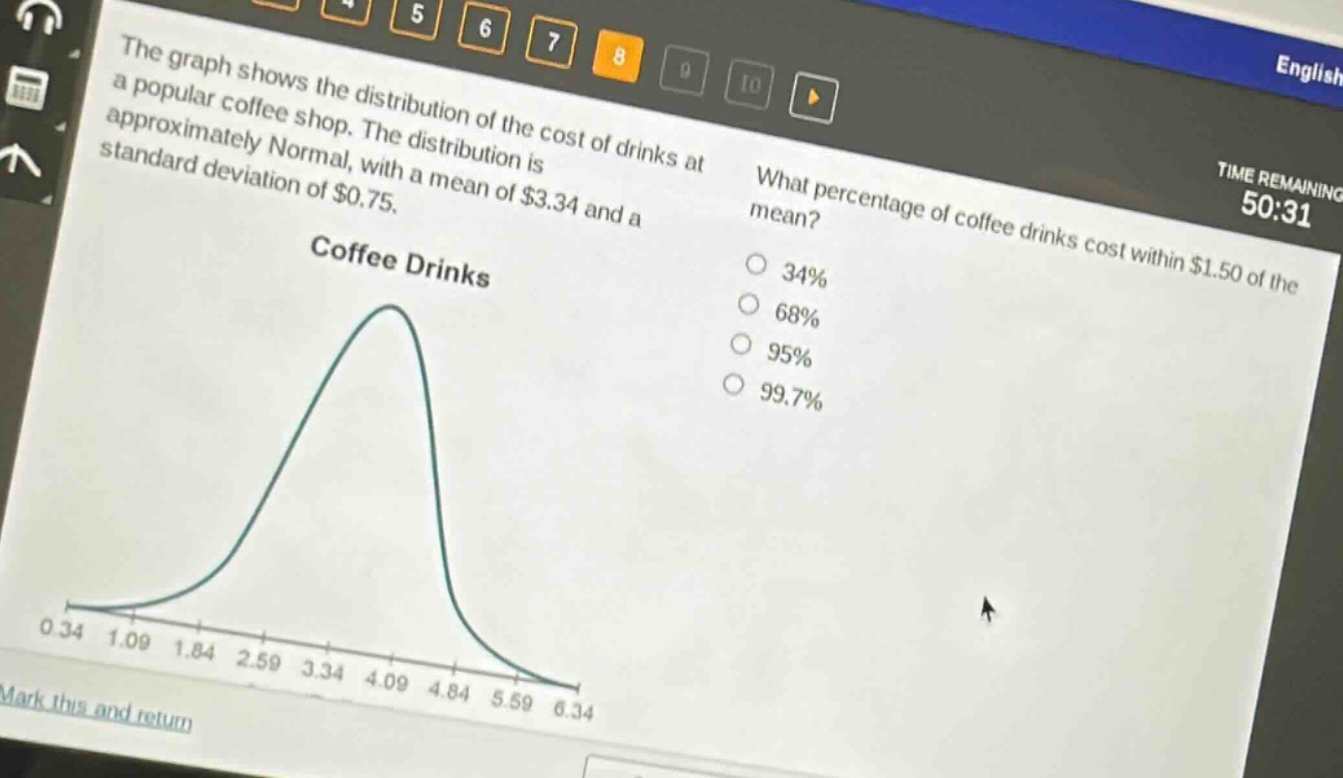
the graph shows the distribution of the cost of drinks at a popular coffee shop. the distribution is approximately normal, with a mean of $3.34 and a standard deviation of $0.75. what percentage of coffee drinks cost within $1.50 of the mean? 34% 68% 95% 99.7%
Answer
Answer:
C. 95%
Explanation:
Step1: Calculate number of standard - deviations
Given standard deviation $\sigma = 0.75$ and range from mean is $1.50$. Calculate $z=\frac{1.50}{0.75}=2$.
Step2: Apply the empirical rule
For a normal distribution, approximately 95% of the data lies within 2 standard - deviations of the mean.