the graph shows a distribution of data. what is the standard deviation of the data? 0.5 1.5 2.0 2.5
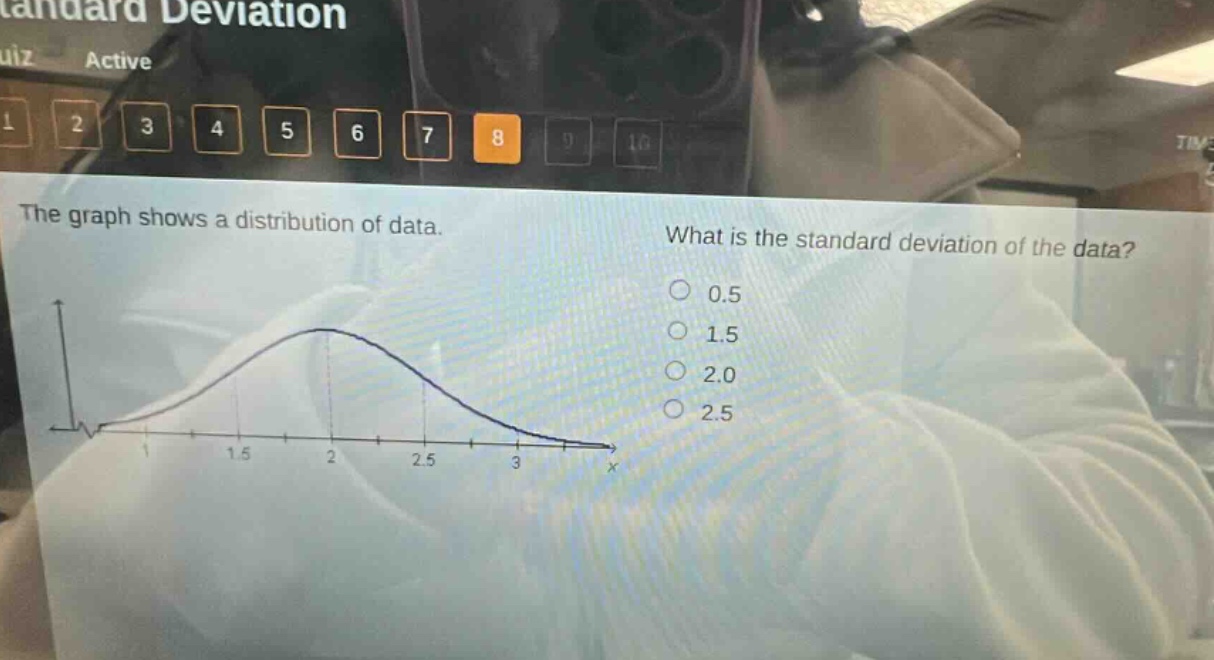
the graph shows a distribution of data. what is the standard deviation of the data? 0.5 1.5 2.0 2.5
Answer
Explanation:
Step1: Recall normal - distribution property
In a normal distribution, about 68% of the data lies within 1 standard - deviation of the mean. If the mean is at (x = 2), and we assume the data is normally distributed, and we look at the spread of the data around the mean.
Step2: Estimate the spread
The data seems to spread from approximately (x = 1.5) to (x = 2.5) around the mean (x = 2). The distance from the mean to one of these points is (2 - 1.5=0.5) or (2.5 - 2 = 0.5). This distance represents 1 standard - deviation in a normal distribution.
Answer:
0.5