the graph shows a distribution of data with a standard deviation of 6. which statement is true about the…
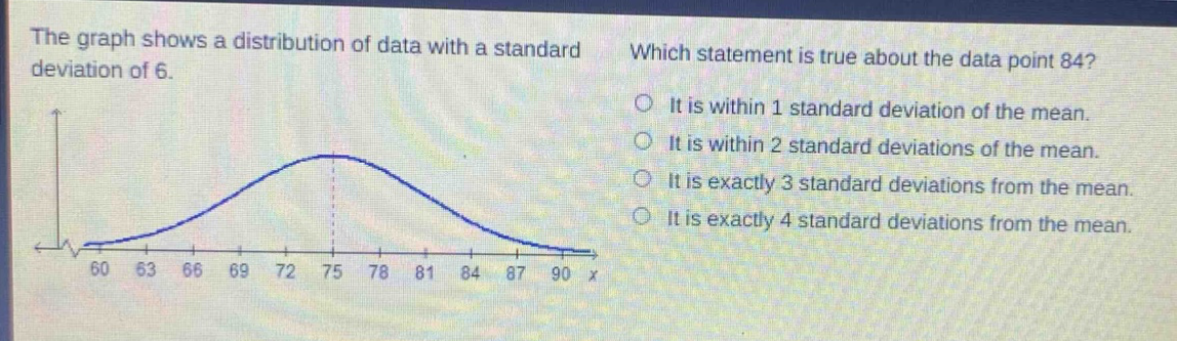
the graph shows a distribution of data with a standard deviation of 6. which statement is true about the data point 84? it is within 1 standard deviation of the mean. it is within 2 standard deviations of the mean. it is exactly 3 standard deviations from the mean. it is exactly 4 standard deviations from the mean.
Answer
Explanation:
Step1: Identify mean and standard - deviation
The mean is 75 (the center of the normal - distribution curve) and the standard deviation $\sigma = 6$.
Step2: Calculate the ranges for standard - deviation intervals
The range within 1 standard deviation of the mean is $75\pm6$, i.e., $[69,81]$. The range within 2 standard deviations of the mean is $75\pm2\times6=75\pm12$, i.e., $[63,87]$. The range within 3 standard deviations of the mean is $75\pm3\times6 = 75\pm18$, i.e., $[57,93]$. The range within 4 standard deviations of the mean is $75\pm4\times6=75\pm24$, i.e., $[51,99]$.
Step3: Determine the position of 84
Since $63<84<87$, 84 is within 2 standard deviations of the mean.
Answer:
It is within 2 standard deviations of the mean.