the graph shows a distribution of data with a standard deviation of 6. which statement is true about the…
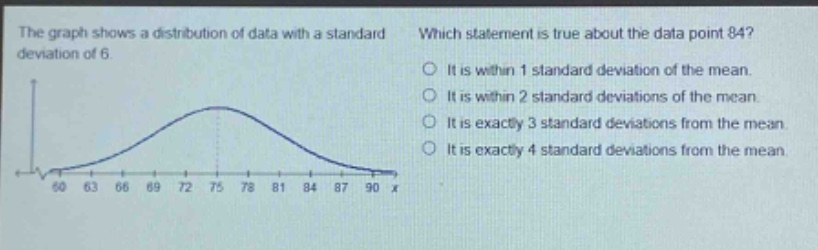
the graph shows a distribution of data with a standard deviation of 6. which statement is true about the data point 84? it is within 1 standard deviation of the mean. it is within 2 standard deviations of the mean. it is exactly 3 standard deviations from the mean. it is exactly 4 standard deviations from the mean. 60 63 66 69 72 75 78 81 84 87 90 x
Answer
Explanation:
Step1: Identify the mean
The graph is symmetric and the peak is at $x = 75$, so the mean $\mu=75$.
Step2: Calculate the number of standard - deviations from the mean
The standard deviation $\sigma = 6$. We use the formula $z=\frac{x-\mu}{\sigma}$, where $x = 84$, $\mu = 75$ and $\sigma=6$. Then $z=\frac{84 - 75}{6}=\frac{9}{6}=1.5$.
Answer:
It is within 2 standard deviations of the mean.