the graph shows the distribution of the lengths (in seconds) of videos on a popular video - streaming site…
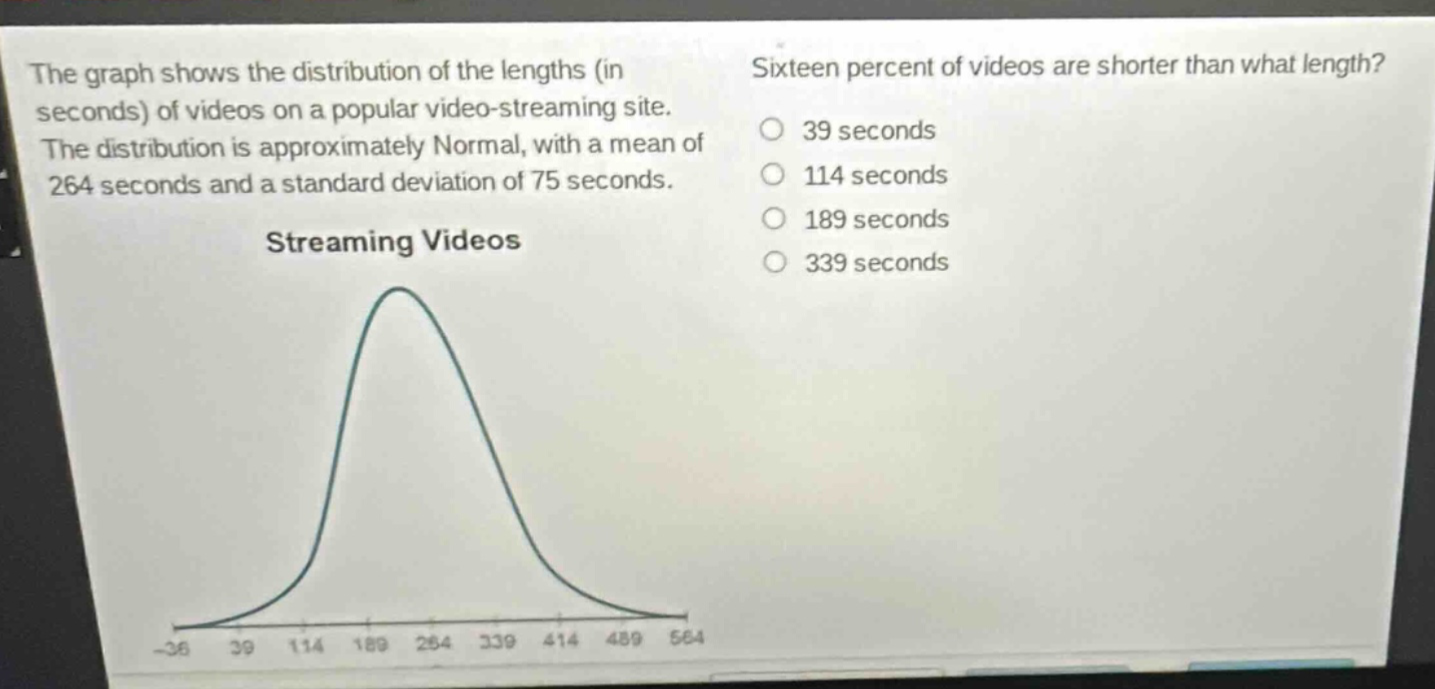
the graph shows the distribution of the lengths (in seconds) of videos on a popular video - streaming site. the distribution is approximately normal, with a mean of 264 seconds and a standard deviation of 75 seconds. streaming videos sixteen percent of videos are shorter than what length? 39 seconds 114 seconds 189 seconds 339 seconds
Answer
Answer:
189 seconds
Explanation:
Step1: Recall the properties of normal distribution
In a normal - distribution, about 16% of the data lies below 1 standard deviation below the mean.
Step2: Calculate the value
Given mean $\mu = 264$ seconds and standard deviation $\sigma=75$ seconds. The value 1 standard - deviation below the mean is $\mu-\sigma=264 - 75=189$ seconds. So 16 percent of videos are shorter than 189 seconds.