the graph shows the distribution of the number of text messages young adults send per day. the distribution…
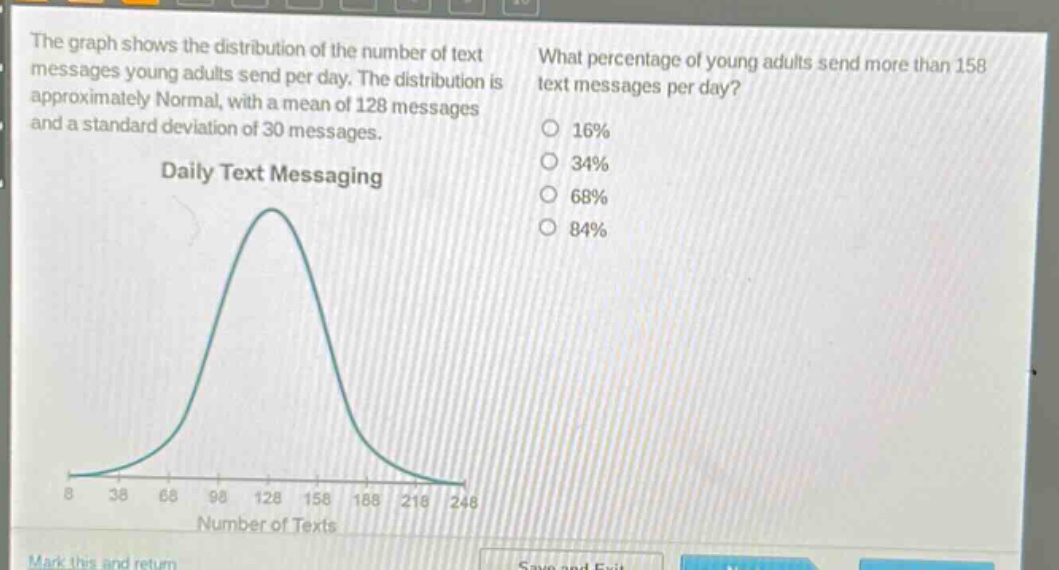
the graph shows the distribution of the number of text messages young adults send per day. the distribution is approximately normal, with a mean of 128 messages and a standard deviation of 30 messages. what percentage of young adults send more than 158 text messages per day? 16% 34% 68% 84% daily text messaging 8 38 68 98 128 158 188 218 248 number of texts
Answer
Answer:
A. 16%
Explanation:
Step1: Calculate z - score
The z - score formula is $z=\frac{x-\mu}{\sigma}$, where $x = 158$, $\mu=128$, $\sigma = 30$. So $z=\frac{158 - 128}{30}=\frac{30}{30}=1$.
Step2: Use the empirical rule
For a normal distribution, about 68% of the data lies within 1 standard - deviation of the mean ($\mu\pm\sigma$), which means 34% of the data lies between $\mu$ and $\mu+\sigma$ and 34% lies between $\mu$ and $\mu - \sigma$. The total area to the left of $\mu+\sigma$ is 50%+34% = 84%. So the area to the right of $\mu+\sigma$ (i.e., the percentage of values greater than $\mu+\sigma$) is 100% - 84%=16%. Since $x = 158=\mu+\sigma$ (with $\mu = 128$ and $\sigma = 30$), the percentage of young adults who send more than 158 text messages per day is 16%.