the graph below shows the experimental probability of a runner finishing in first place (1), in second place…
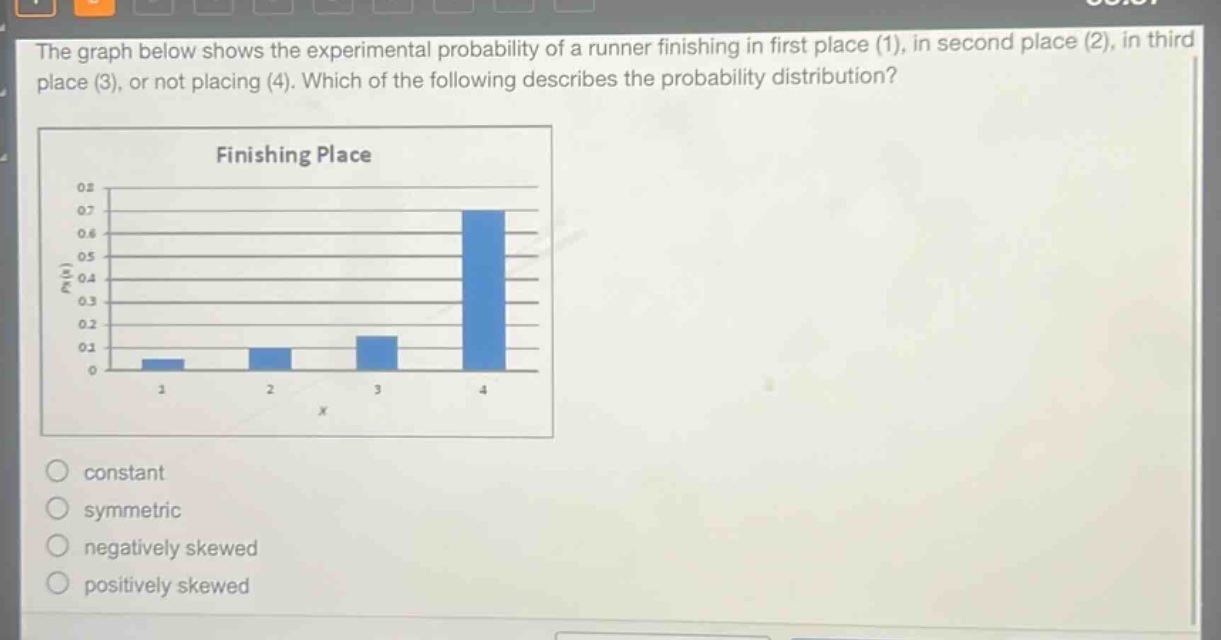
the graph below shows the experimental probability of a runner finishing in first place (1), in second place (2), in third place (3), or not placing (4). which of the following describes the probability distribution?\nfinishing place\nconstant\nsymmetric\nnegatively skewed\npositively skewed
Answer
Explanation:
Step 1: Analyze the probability distribution graph
The graph shows varying probabilities for different finishing places. The highest probability is at the highest numerical category (4), with lower probabilities at lower numerical categories (1, 2, 3).
Step 2: Determine skewness direction
Skewness depends on the tail direction. A negatively skewed distribution has a tail on the left (lower values), while a positively skewed distribution has a tail on the right (higher values). Here, the lower values (1, 2, 3) have lower probabilities and form a tail on the left.
Answer:
negatively skewed