the graph shows the exponential regression model for data representing a rabbit population after x years…
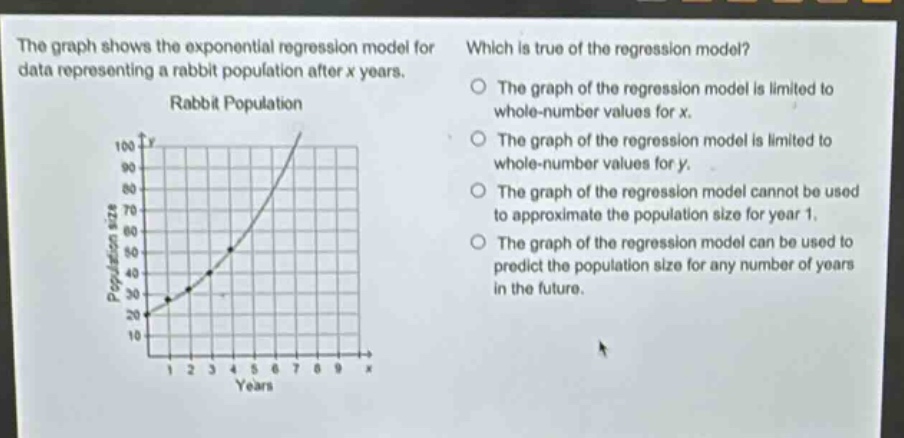
the graph shows the exponential regression model for data representing a rabbit population after x years. which is true of the regression model? rabbit population the graph of the regression model is limited to whole - number values for x. the graph of the regression model is limited to whole - number values for y. the graph of the regression model cannot be used to approximate the population size for year 1. the graph of the regression model can be used to predict the population size for any number of years in the future.
Answer
Brief Explanations:
- Analyze each option:
- For the x - variable (years), in a real - world context of time, it can be any non - negative real number (e.g., 1.5 years is a valid time period), not just whole numbers. So the statement about x being limited to whole numbers is false.
- For the y - variable (population size), in theory, population size can be a non - whole number (e.g., in some statistical or modeled cases), so the statement about y being limited to whole numbers is false.
- The graph of the regression model can be used to approximate the population size for year 1 as it is within the domain of the model.
- The graph of the regression model is based on existing data and assumptions. In the long - term future, there are many factors (such as limited resources, predators, diseases) that can affect the rabbit population and make the model inaccurate. So it cannot be used to predict the population size for any number of years in the future.
Answer:
None of the options are true.